
Loved by millions of creators, teams and businesses worldwide
What our users think of us
“We were paying a lot of money to get this caliber of graphic support prior to Piktochart. Now we’ve eliminated all that cost and a fraction of the time.”
“Our community benefits when they can understand what's happening in the corrections system. Visuals make that possible.”
“What I find with Piktochart is it helps with the aesthetics. It helps me look like I have some sort of graphic design background. It makes what I create look good. That's what I needed. And it was a perfect tool at the perfect time for me.”
“I think I can do things in a way that just seems so easy, especially when I think back as a kid growing up trying to make presentations on PowerPoint. The features that are embedded in Piktochart take the sort of the grid locking to it for me to like a different level. So, I love that because I'm all about the symmetry as much as possible.”
“A lot of the time if you've started down one road, you're sort of boxed in. With Piktochart, I can customize block sizes and suddenly it's exactly what I needed. I love that.”
“It's really a no-brainer to use, I would say. People have told me to try another infographics design platform that is very world-renowned, but I tried it before and I didn't really like the feel and the way it works. Despite several attempts to try to pull me away, I always come back to Piktochart. I think it goes back to the great design of Piktochart.”
“If I don't have Piktochart, I have to go back to Photoshop or Illustrator and it will take me a longer time just to put a photo into a particular shape and frame.”
“I did a lot of research on different platforms, and Piktochart stood out because it offered just as many features as others but at the right price—more for less.”
“We started The Bright Millennial just to market ourselves online. Now, we've grown to 300,000 followers, and it's become our full-time business.”
“We didn't pay for any design work on The Brilliant Box because we used Piktochart to do it ourselves. I guess that was the most cost-effective product because we sell it. It's got a good margin on it, and it didn't actually cost us. It's only cost us the production fees.”
“Instead of paying for 10 different programs, we just pay for one… Because if you're using four different things, you can't be great at four things as opposed to just one you're awesome at.”
“I think that we can say honestly that Piktochart is one of the reasons why that has been more successful because it's helping to create more engaging content.”
“We will continue using Piktochart to grow our brand presence and to help educate people about a more sustainable lifestyle every single day.”
“Now we have a project database where everything is logged and represented visually, so that people can click and see infographics that provide an easy to understand overview.”
“If you’re working on a long format guide and you can offer your client to re-purpose it into a beautiful whitepaper, lead magnet, or even a course, you will give them a feeling that they are maximizing every cent they spend with you.”
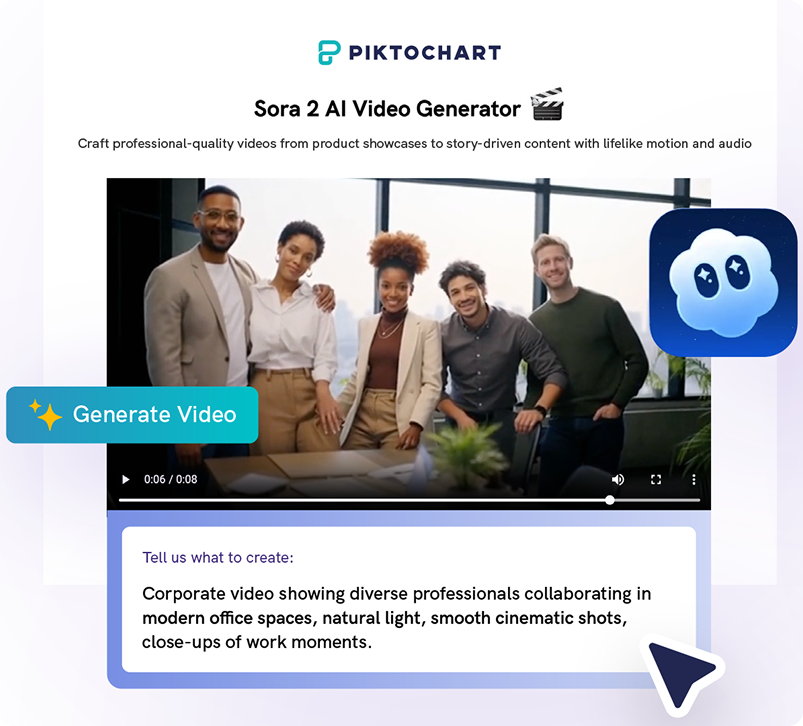
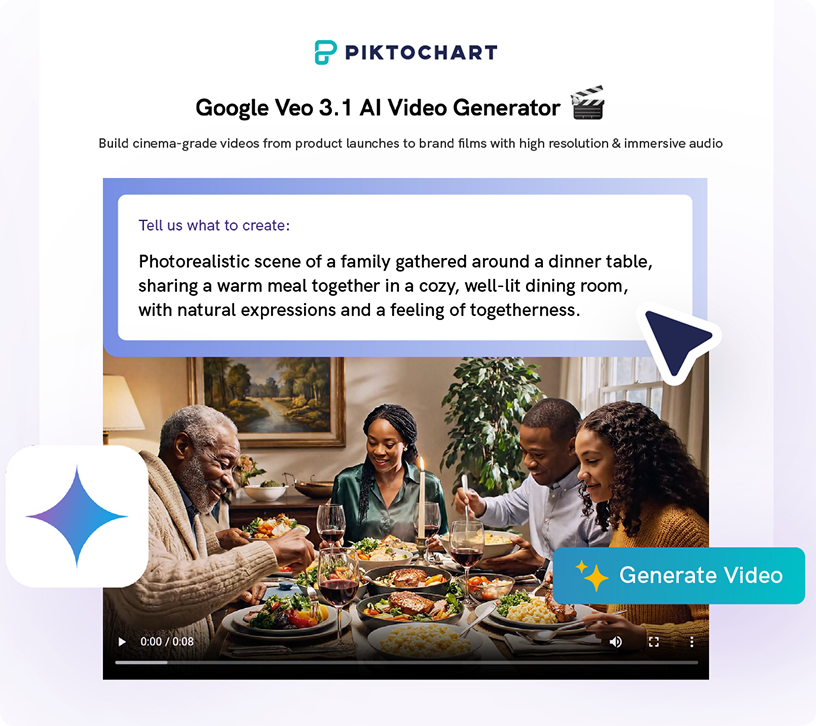
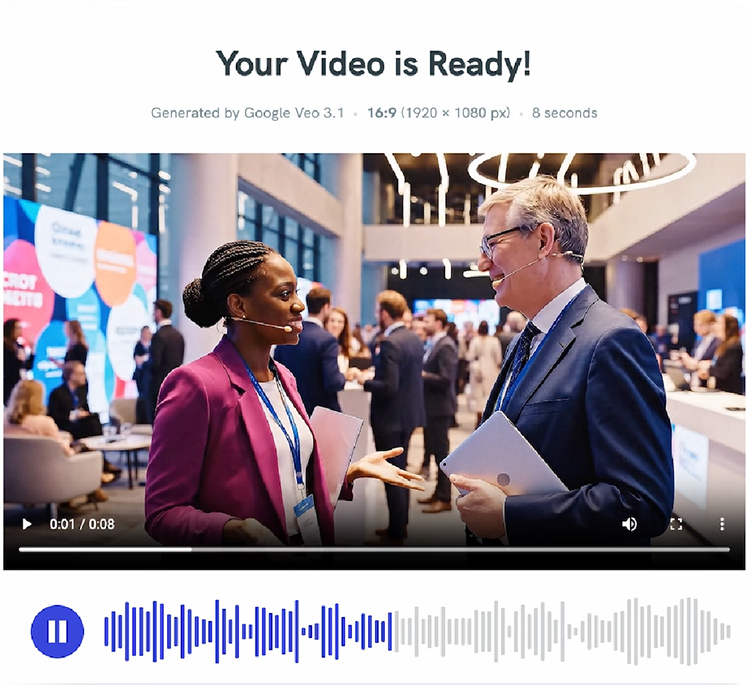
Professional video content without a production budget
Describe the scene. Pikto AI shoots it.
Simply type what you need, from the setting, the tone, and the people, and choose Sora 2 or Veo 3.1 to build it.
Create visuals your audience will trust
The latest state of the art models like Veo 3.1 and Sora 2 renders movement, light, and texture the way a camera does. The result is video content that looks shot on location, not just AI slop.
One video for every platform
Produce videos in multiple aspect ratios, whether for YouTube or TikTok, with a single setting change.
Pikto AI Studio
Your All-in-One Visual Creation Suite
Start Creating For FreeWelcome to a faster, smarter way to create visuals. Pikto AI Studio is your integrated design assistant. Stop juggling multiple apps and start turning marketing data, creative briefs, and simple ideas into stunning visuals—no design experience required.
Watch Your Ideas Come To Life
Your Entire Creative Workflow, Powered by Pikto AI
You type the prompt. Our generative AI builds the visual. See how our AI design generator transforms simple words into stunning visual content in under 10 seconds.
Instantly generate on-brand visuals for your campaigns, so you never have to hunt for stock photos again.
Try It NowYou type the prompt. Our generative AI builds the visual. See how our AI design generator transforms simple words into stunning visual content in under 10 seconds.
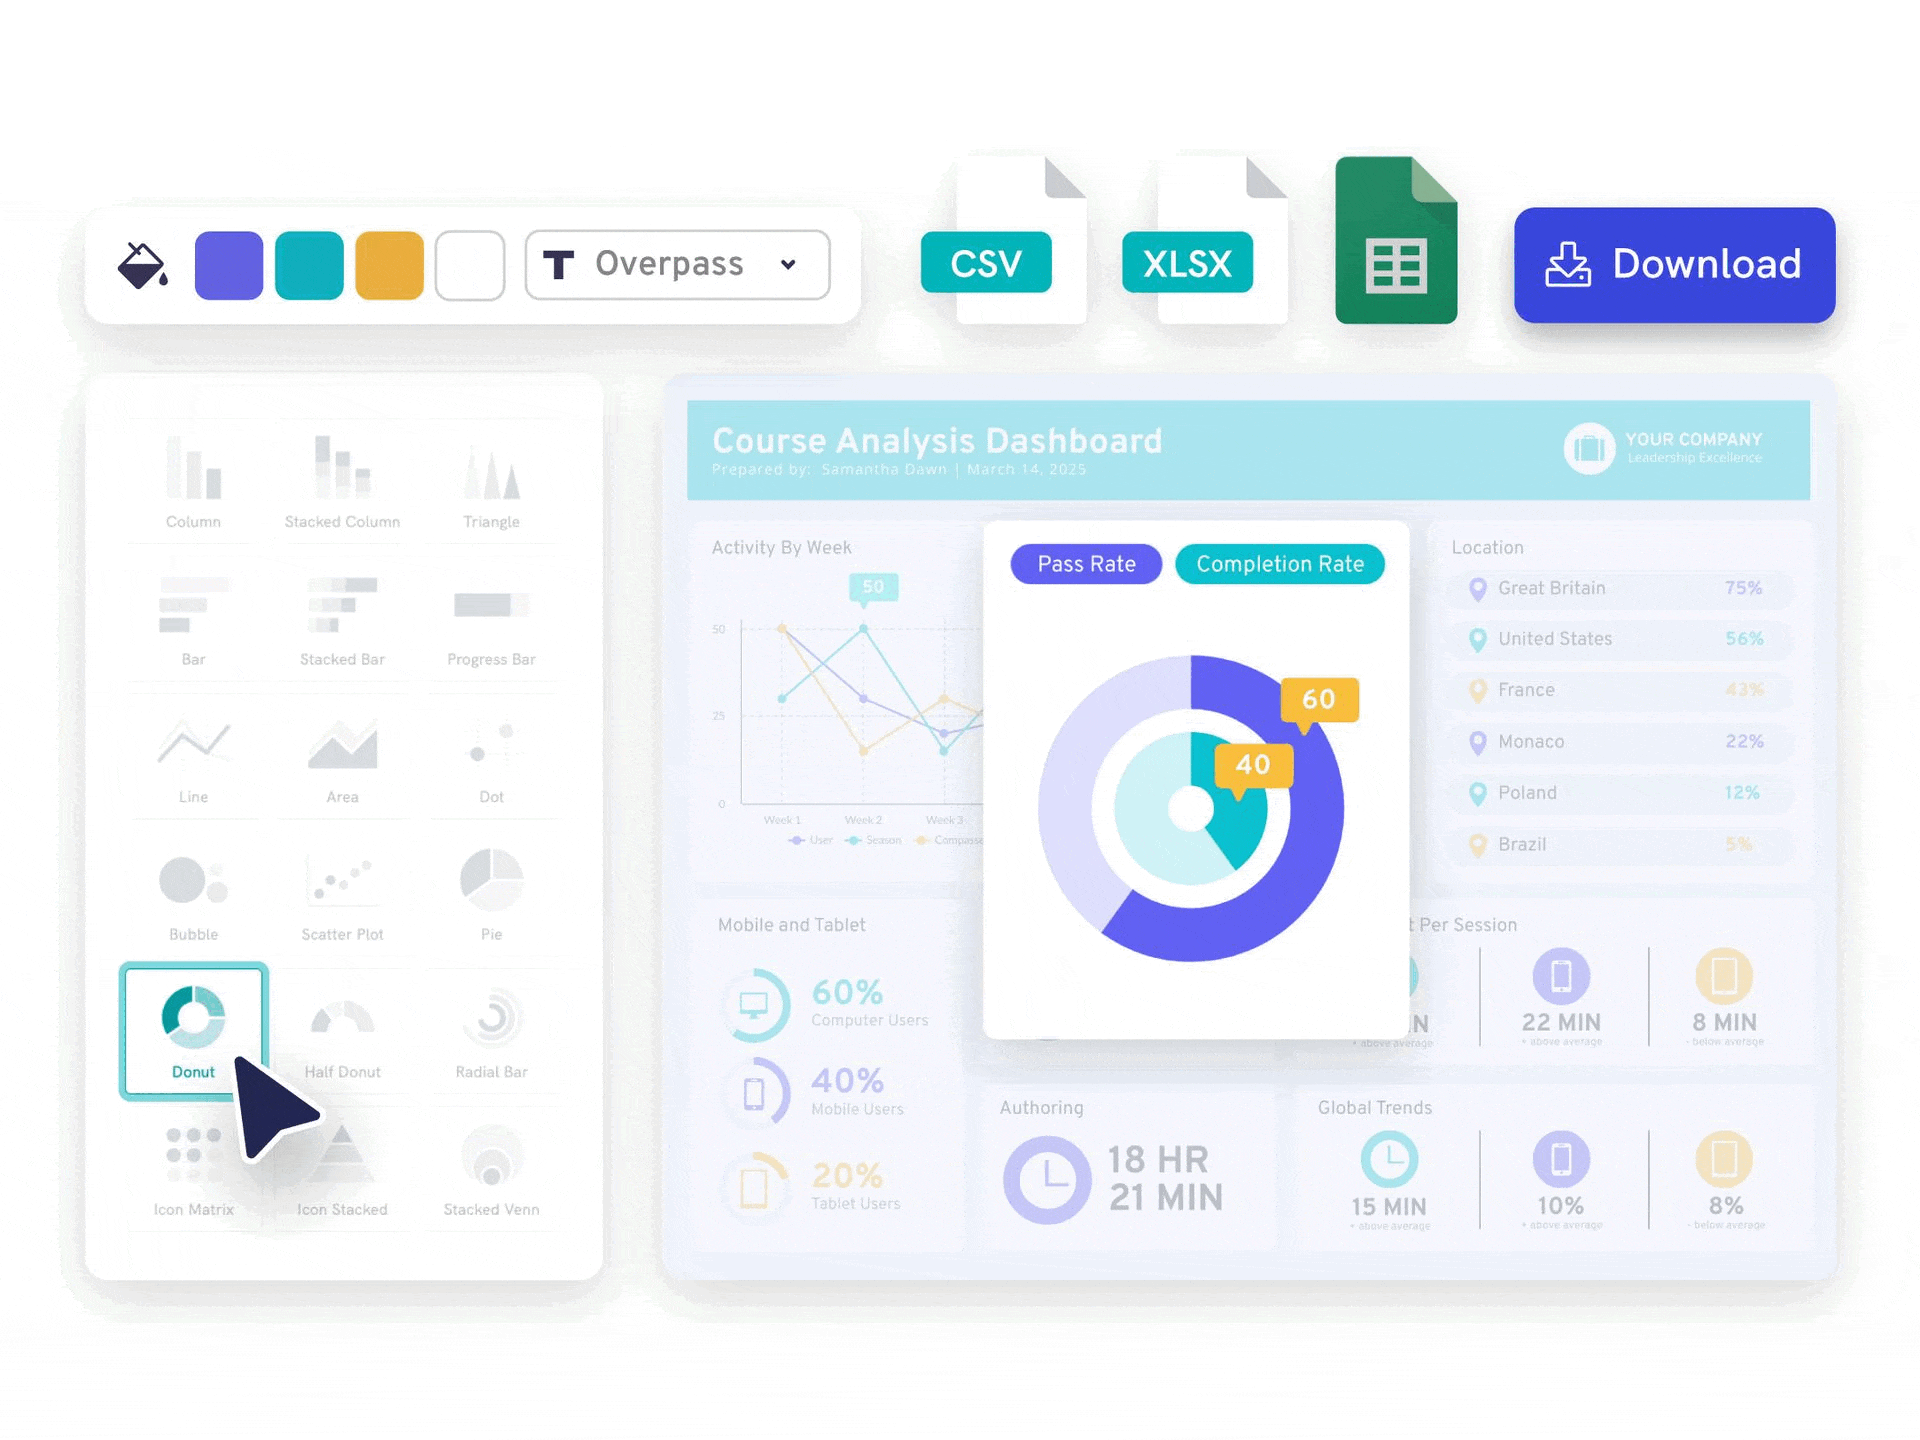
Create a graph or a chart in minutes. Pick and customize different types of charts from pie charts, bar charts, pictographs, and more.
Create Charts and Graphs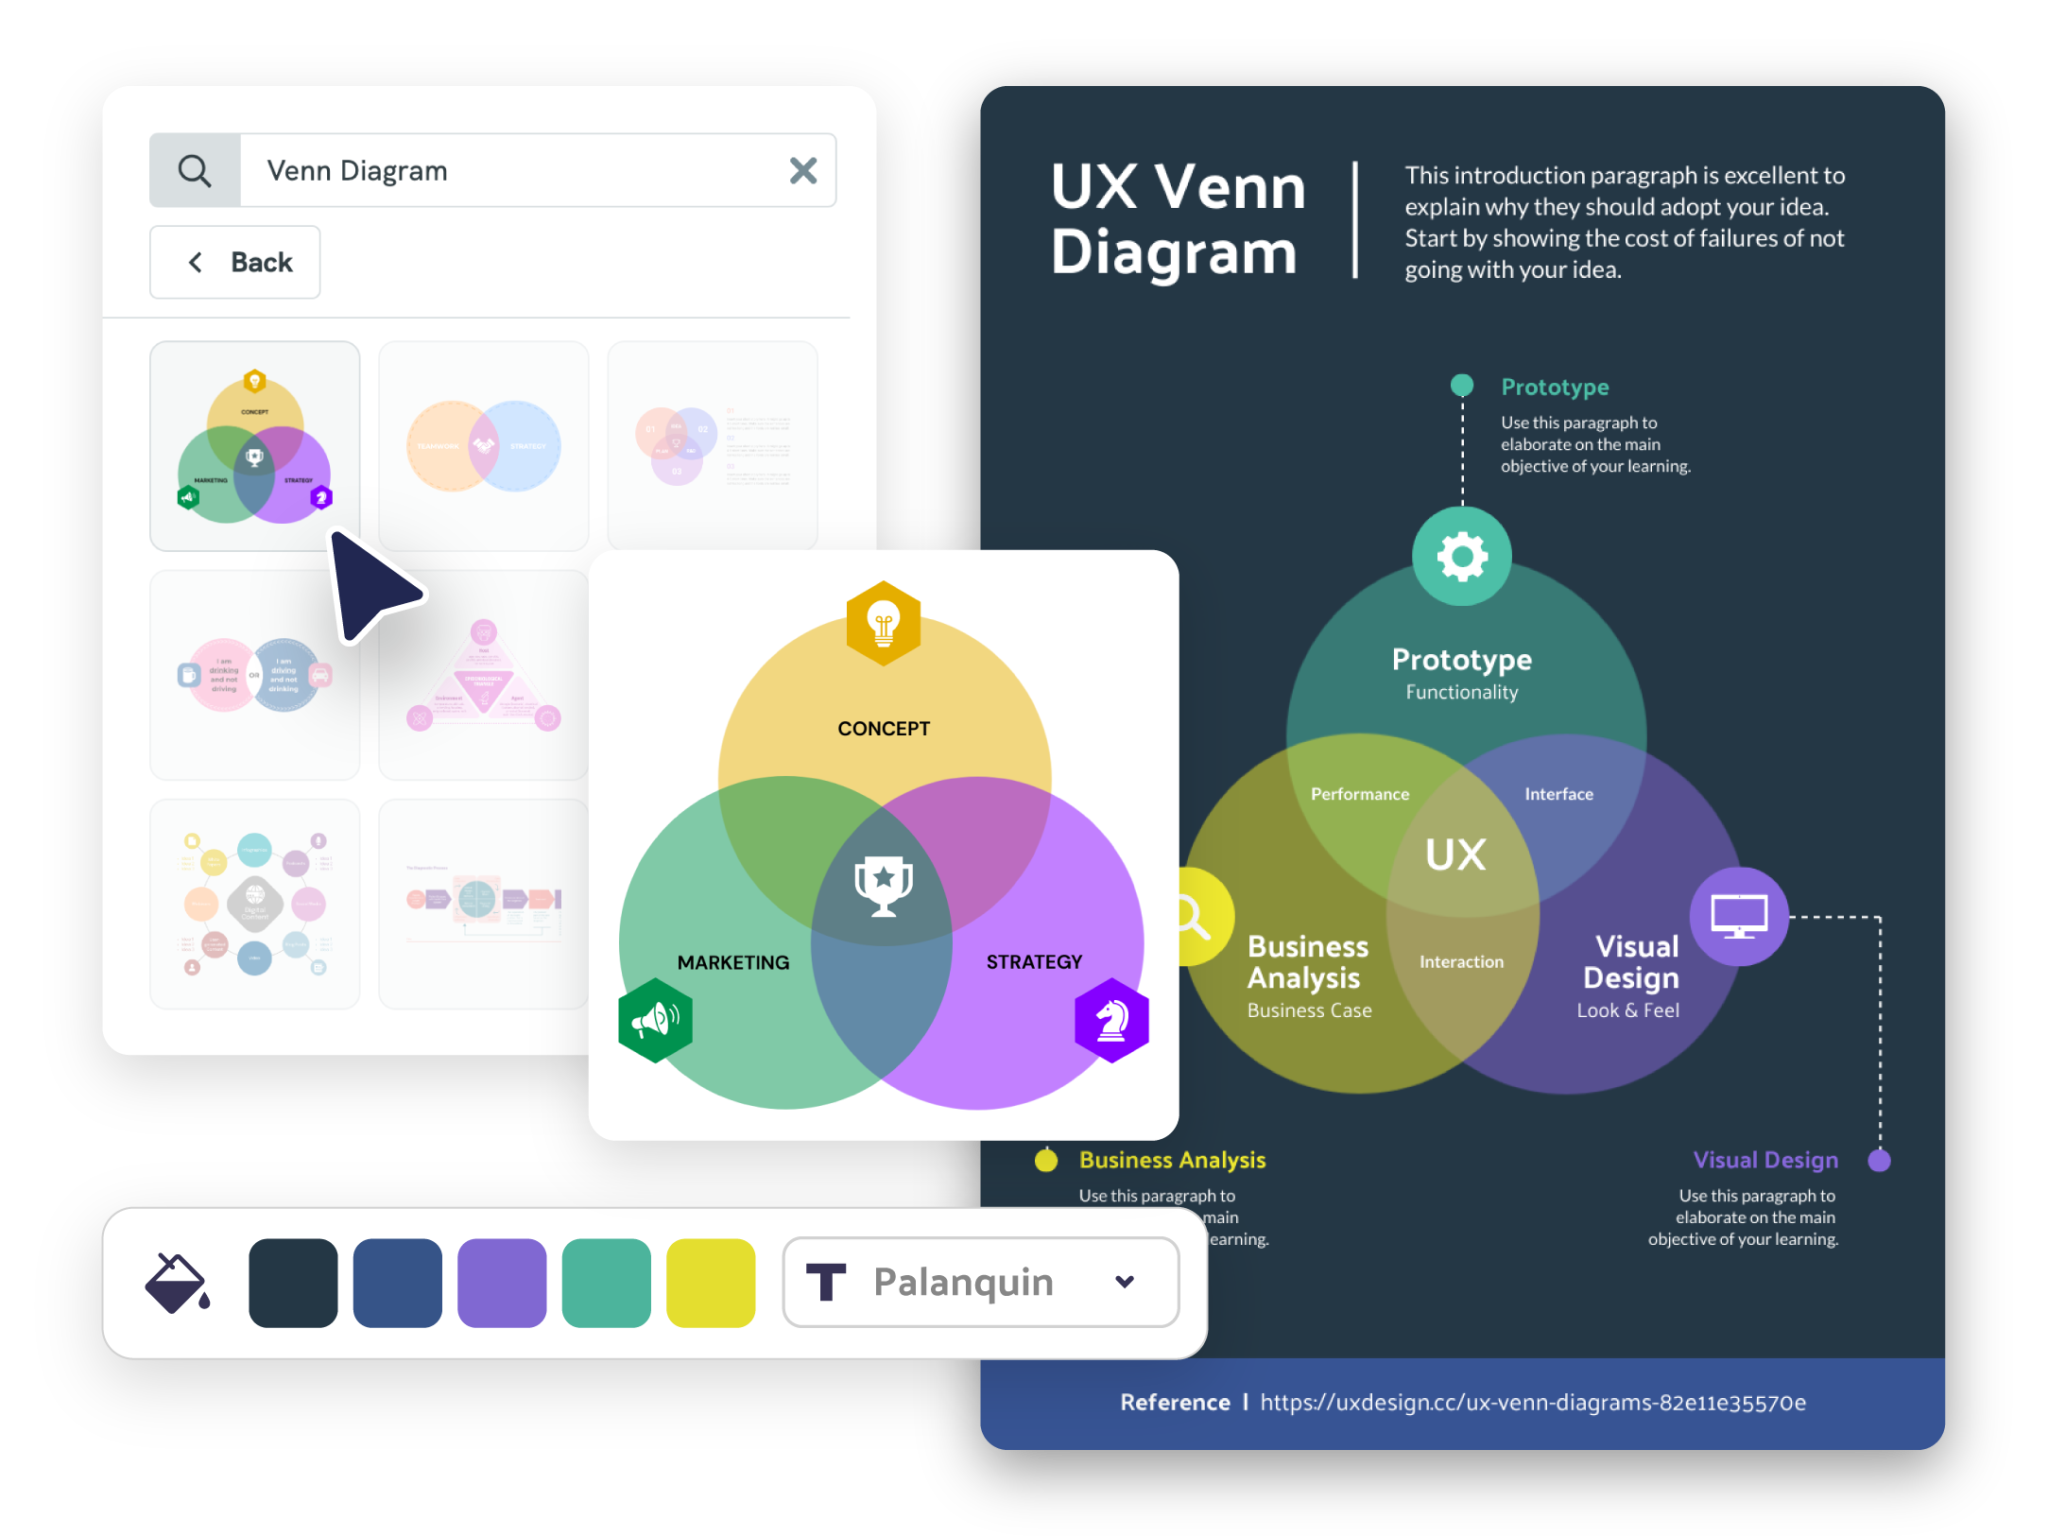
Create diagrams to visualize processes, structures, or concepts without any design experience required.
Create a Diagram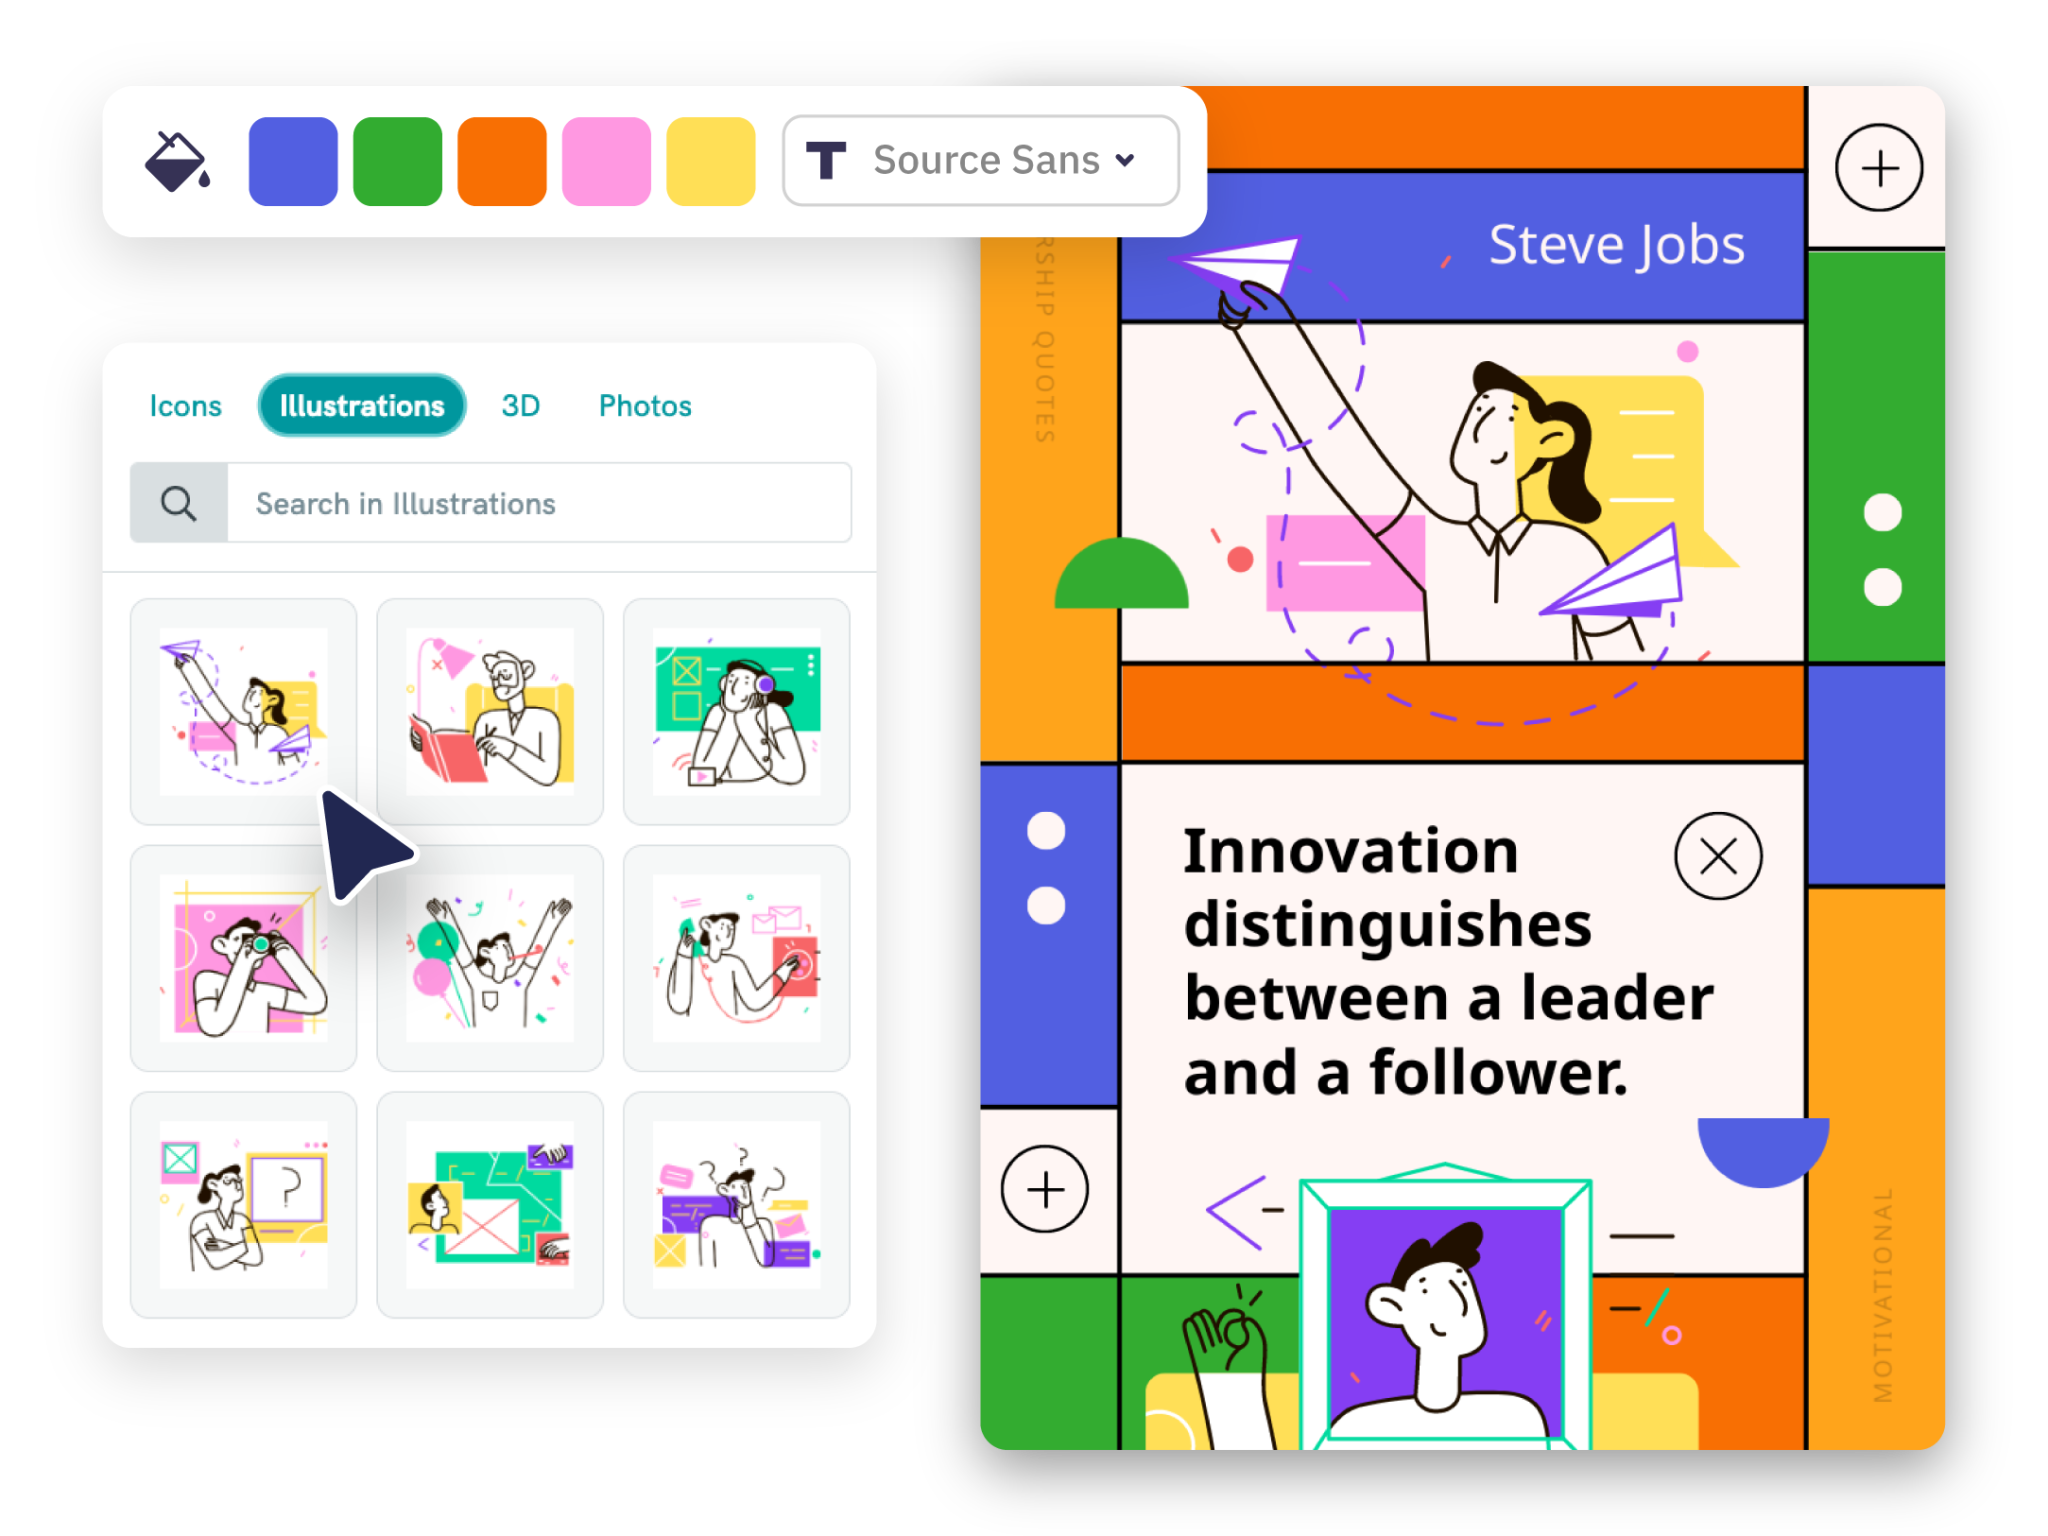
Enhance your message with the use of icons, shapes, illustrations, and photos. Select from our extensive library of design elements or upload your own images for a personalized touch.
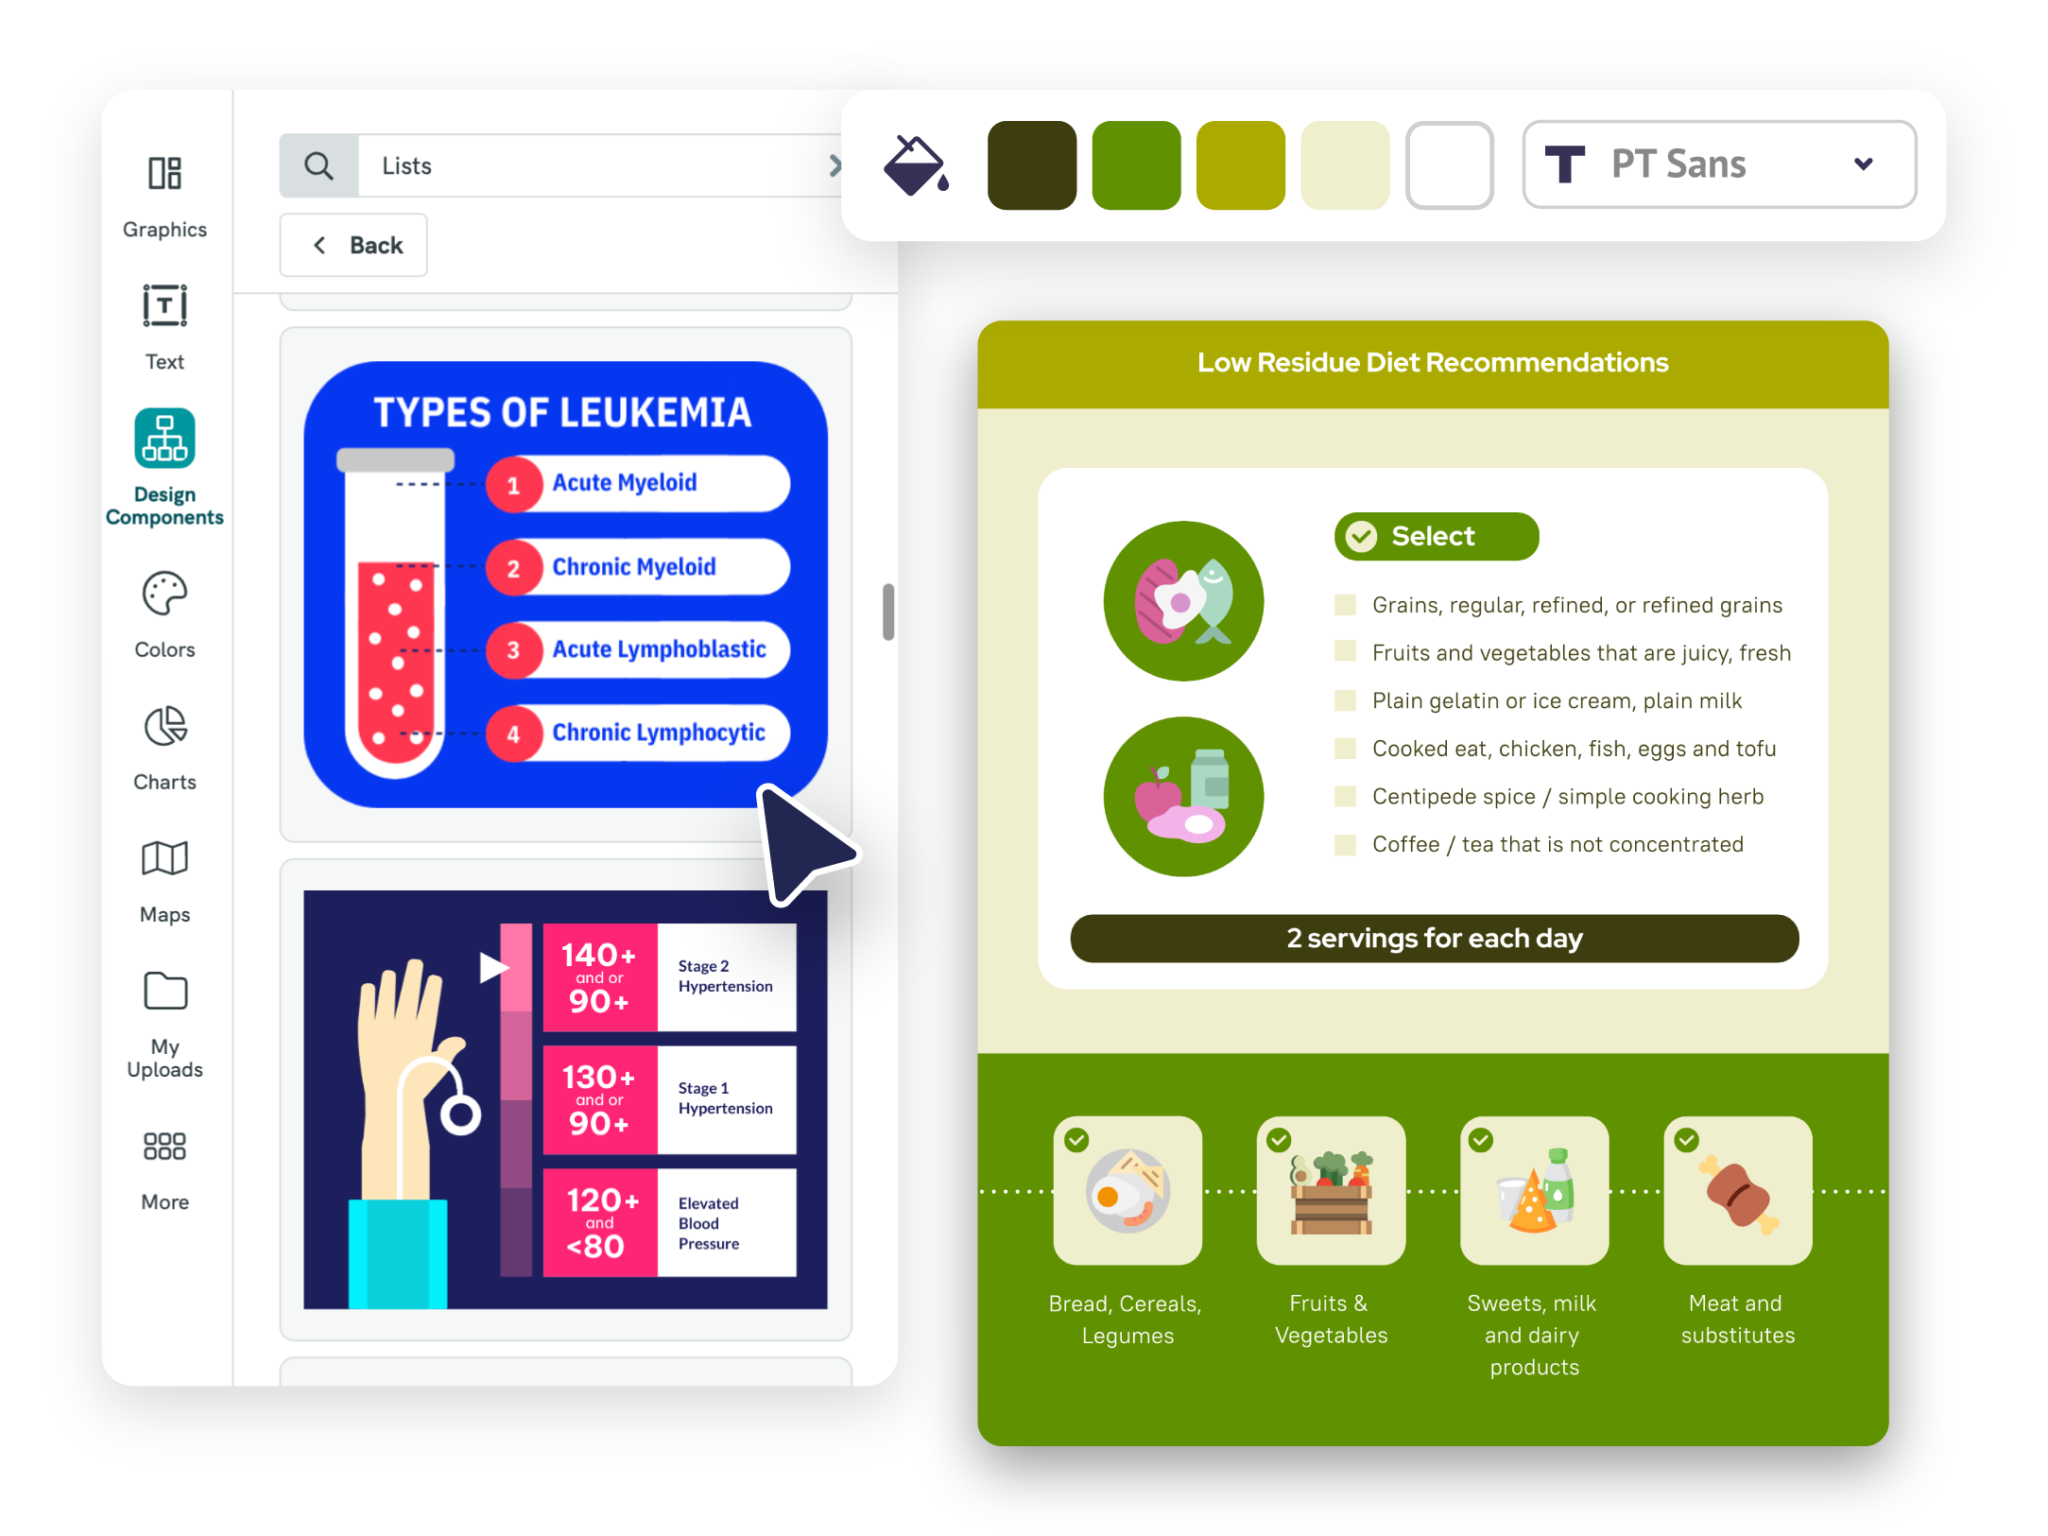
Make your visual look better in a more efficient way with our versatile design components like Masked Photos, Lists, Timelines, Comparisons, and more.
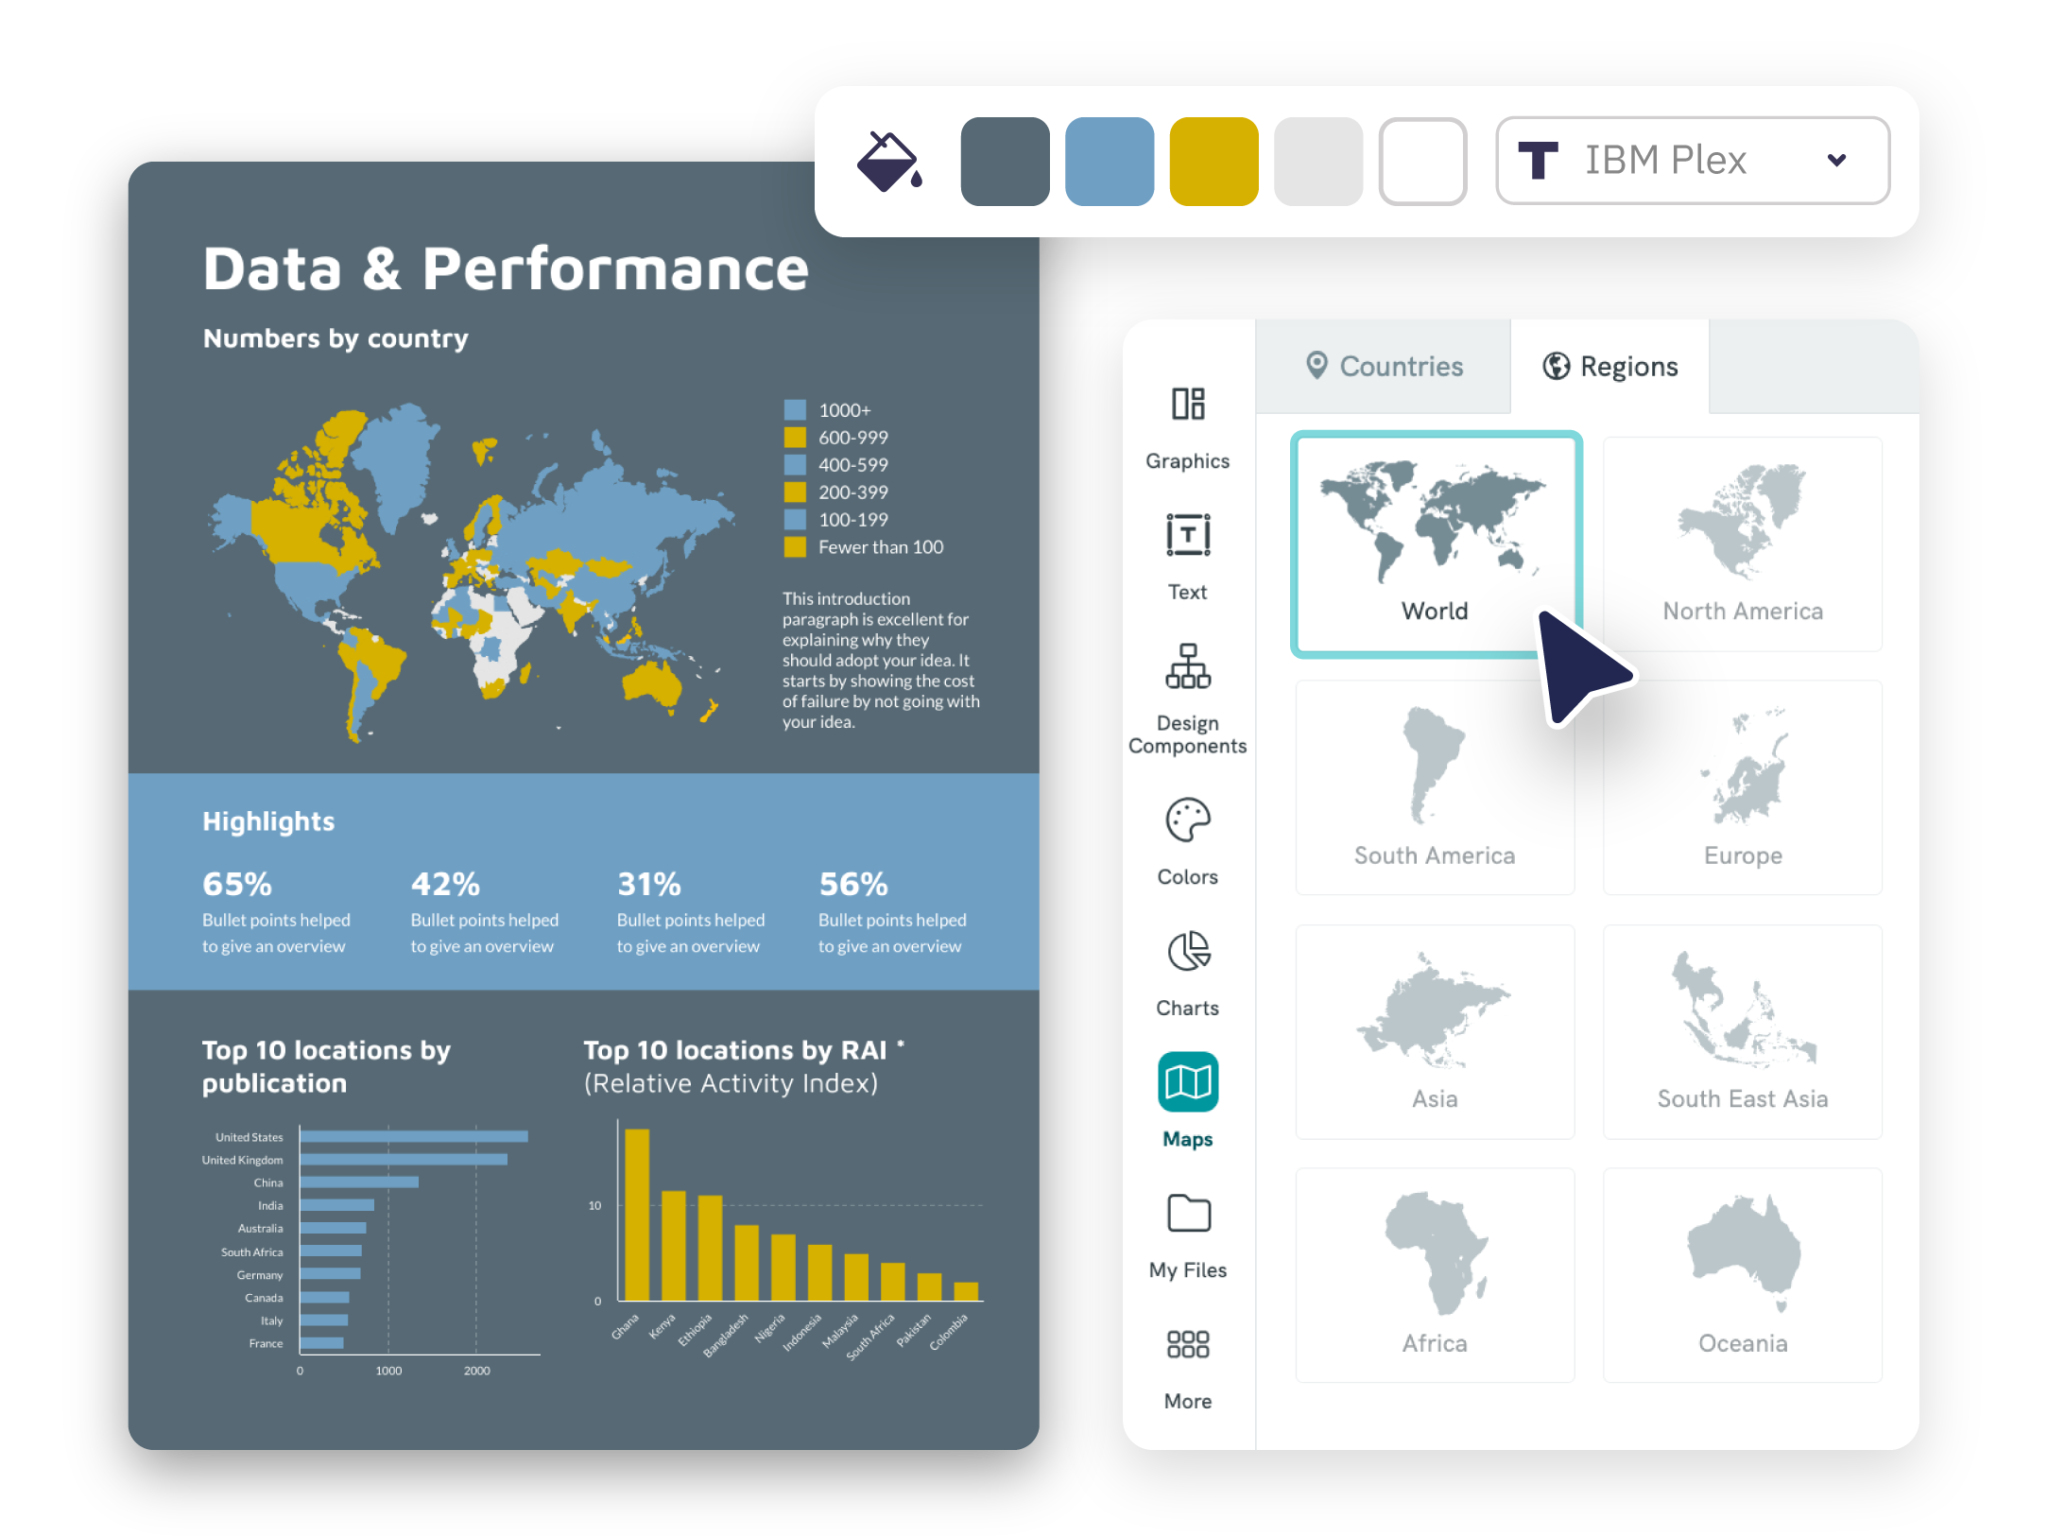
Transform complex data into captivating visuals with our interactive map feature. Visualize geographical data effortlessly and customize maps to your liking!
Create using our Map Maker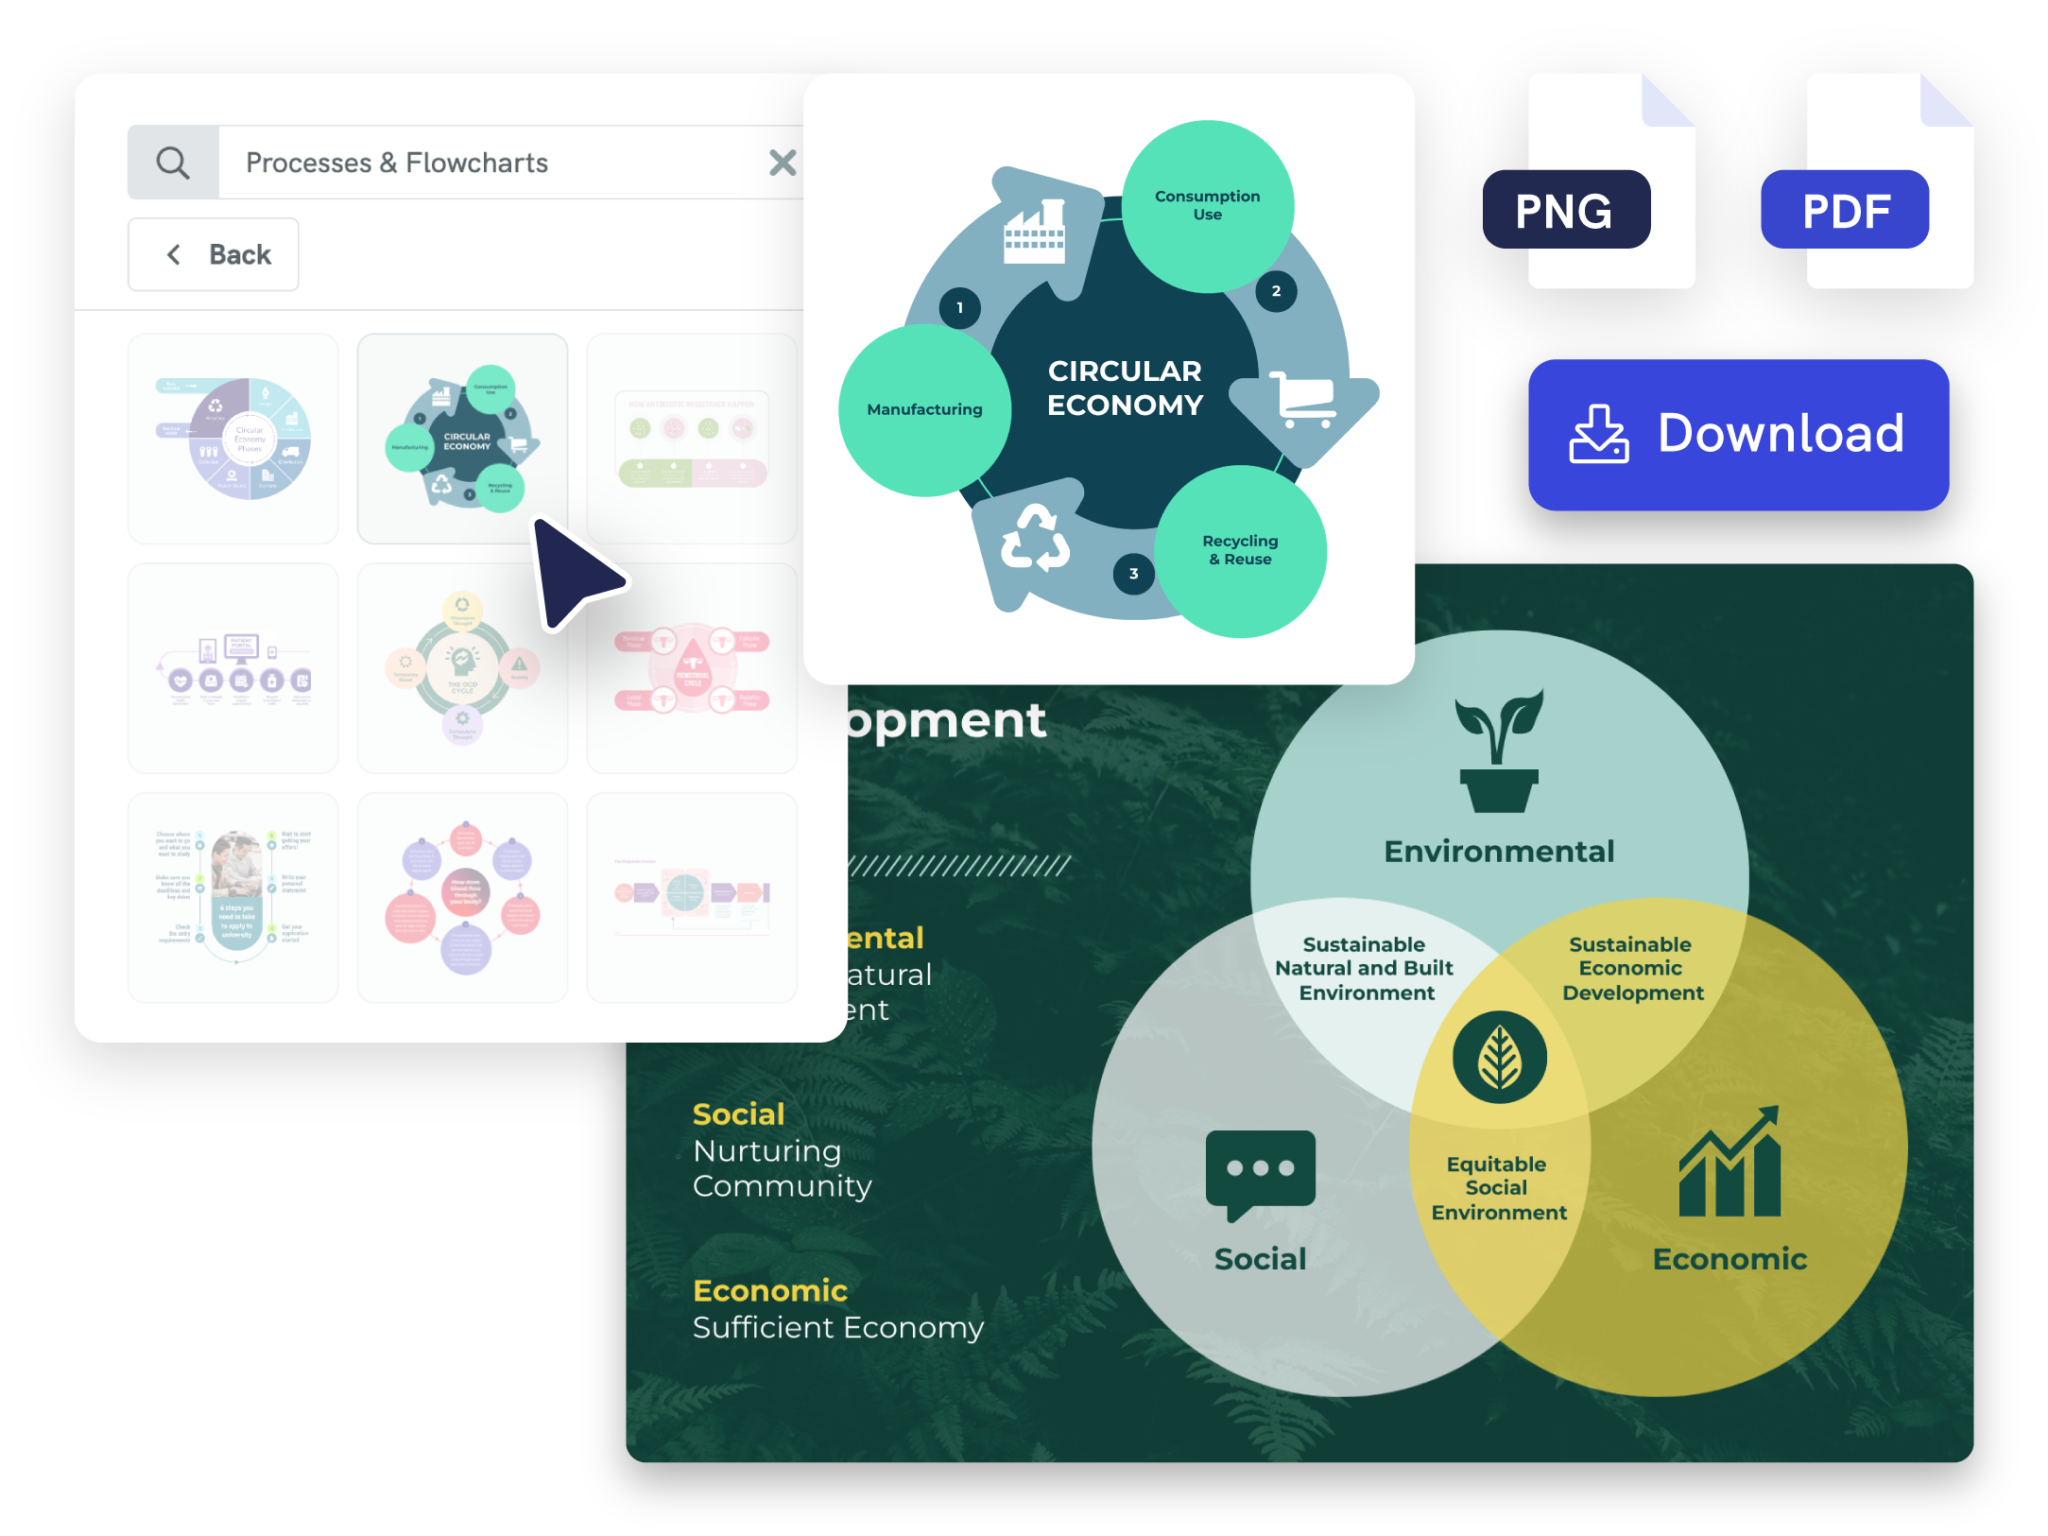
Create clear and intuitive flowcharts to illustrate processes, structures, and organizational charts. Choose from premade templates or build your own using customizable shapes and lines for the perfect flowchart.
Create using our Flowchart Maker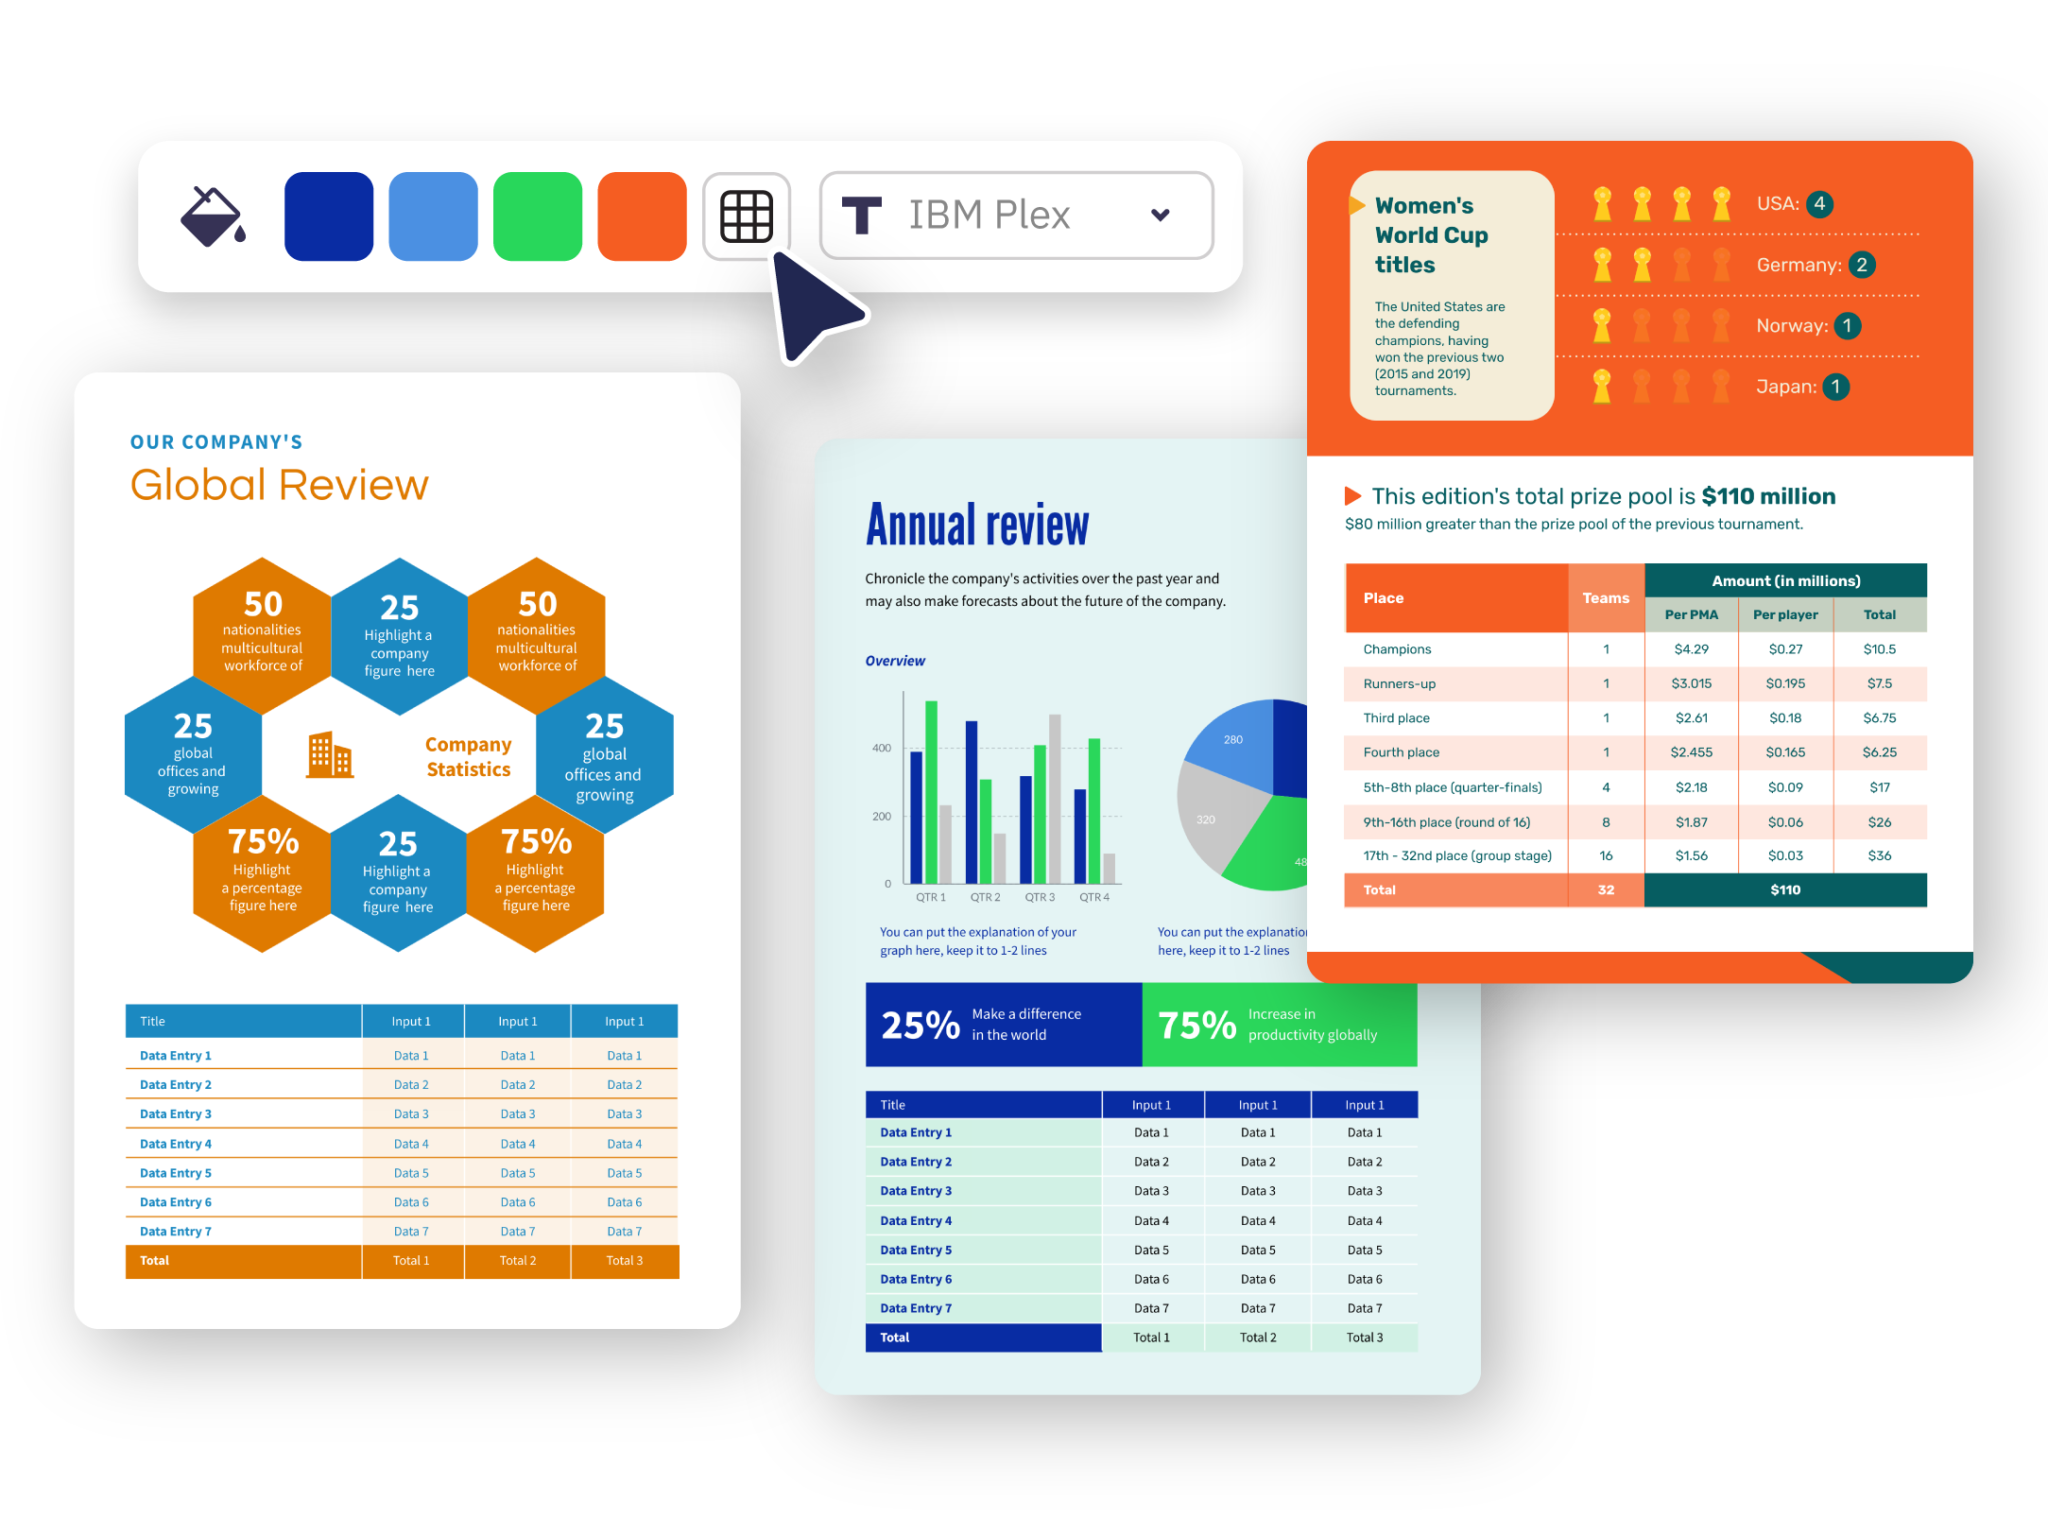
Display information in a more organized manner and make it easier for your audience to read the data with customizable tables.
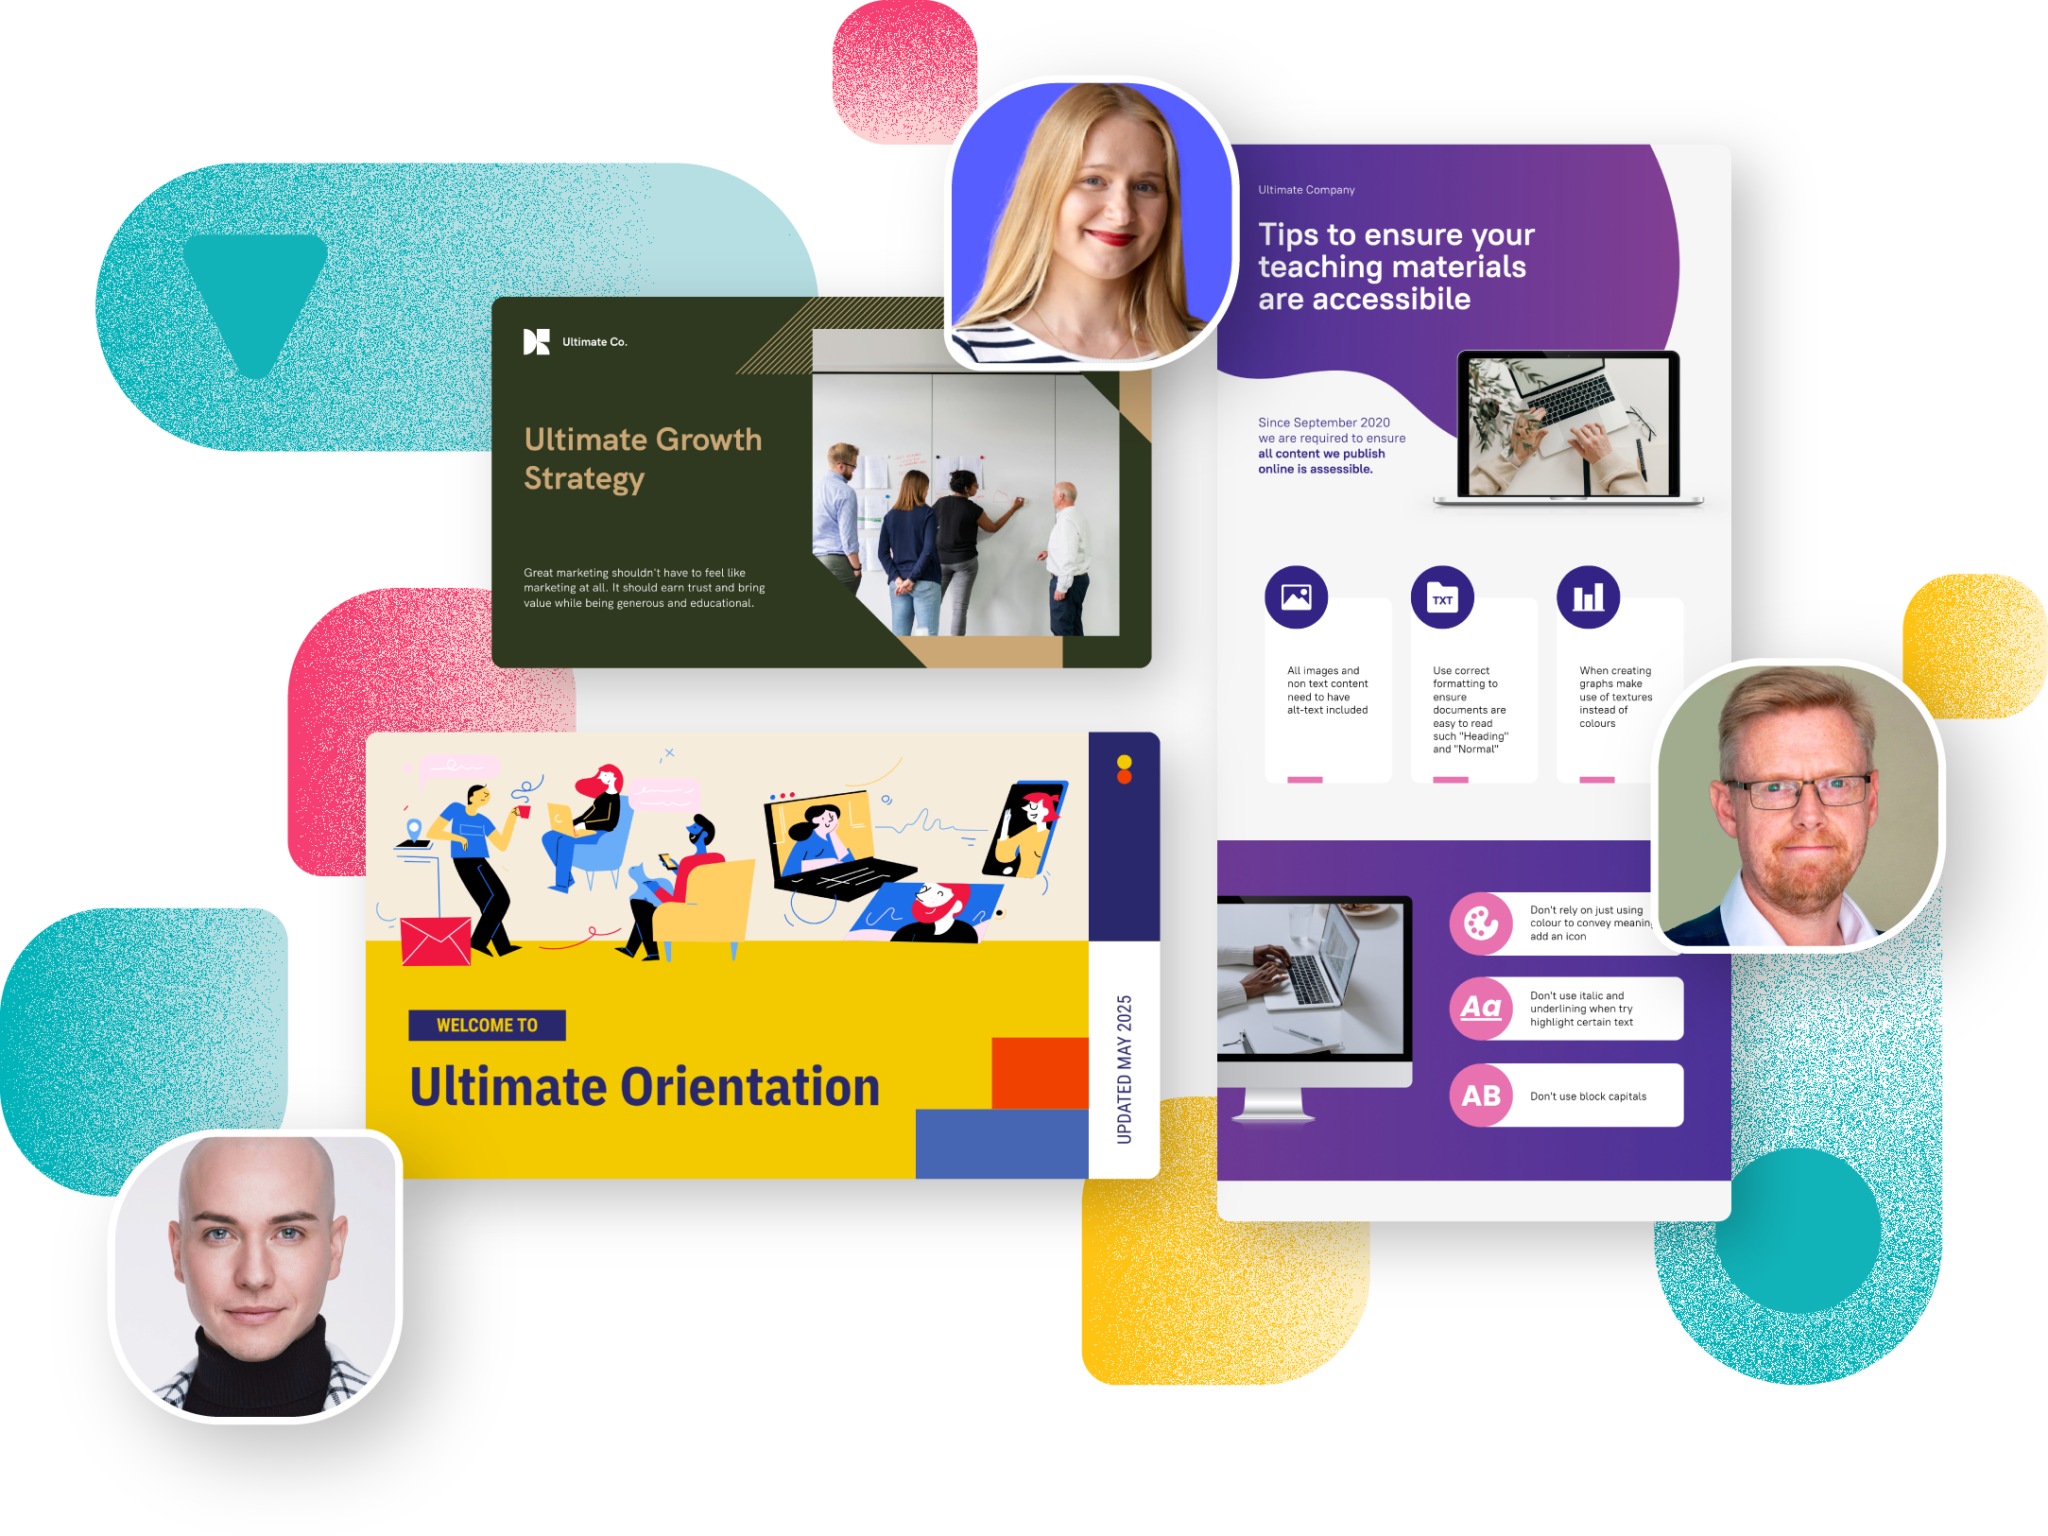
Brand consistency made simple
On-brand designs, on demand, any time
Say goodbye to random designs and ensure brand consistency every time. Brand Assets is your go-to hub for easy access to your brand fonts, colors, and logos. Take your branding further by transforming all Piktochart templates into thousands of stylish, on-brand templates with Branded Templates.
Get started for free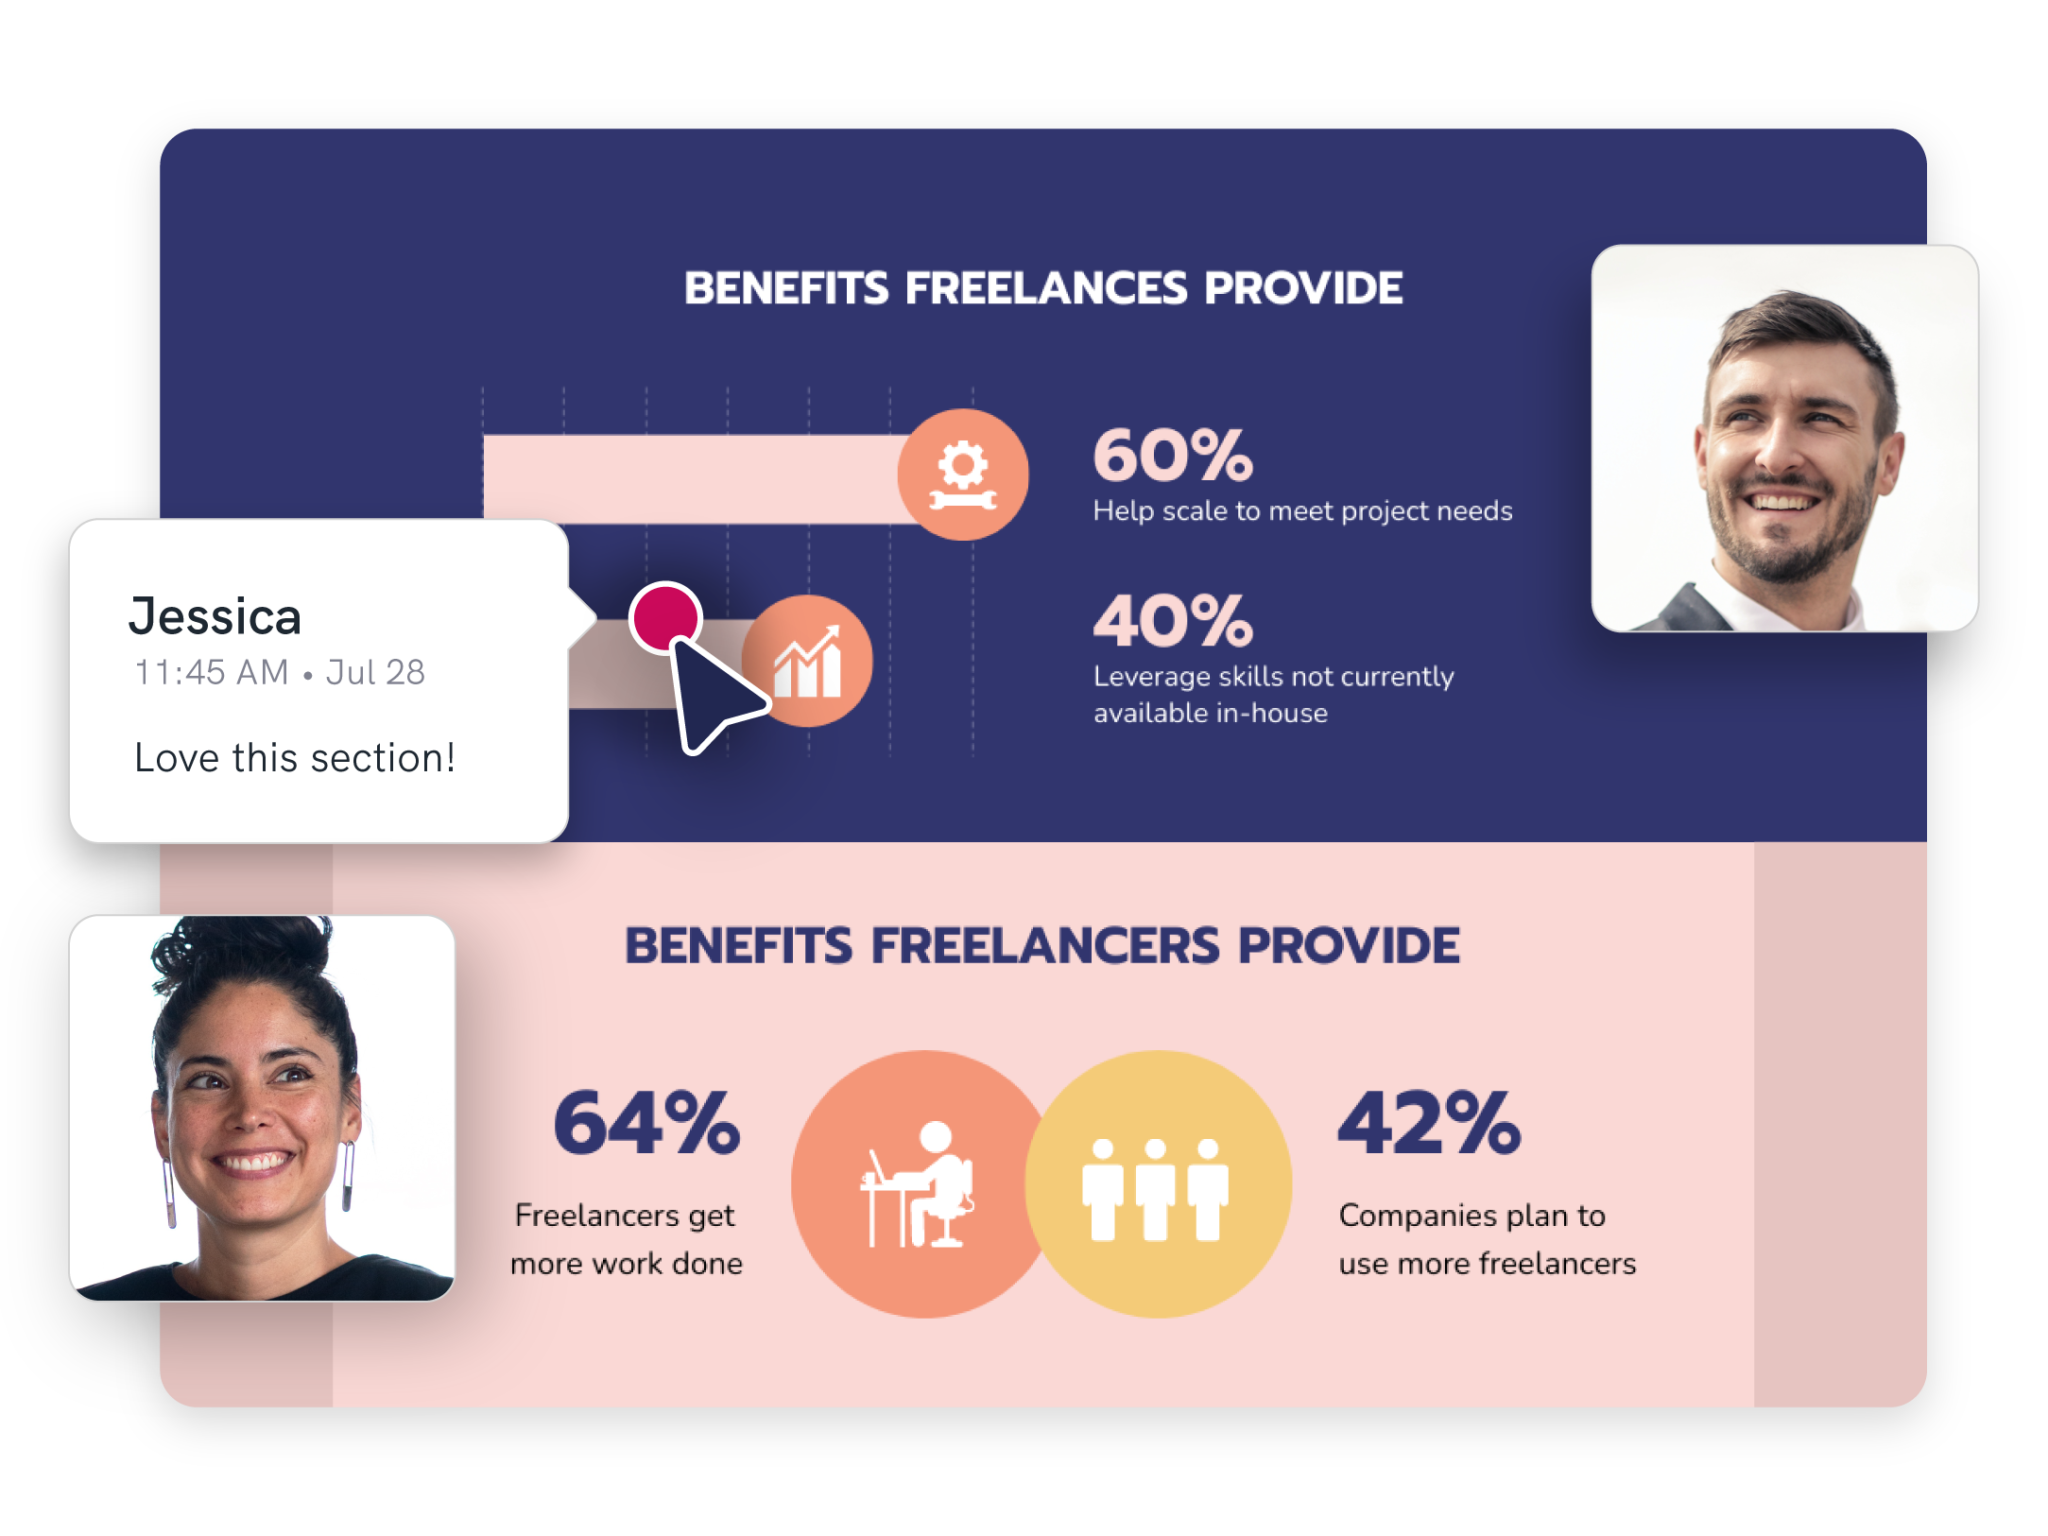
Revolutionize the way teams work together
Streamlined collaboration in a single workspace
An easy-to-use solution for collaborative visual creation, allowing access to a shared library of images and brand assets. Collaborate seamlessly with features for commenting and making revisions, just like in Google Docs or Microsoft Teams. Share, review, and align effortlessly.
Get started for free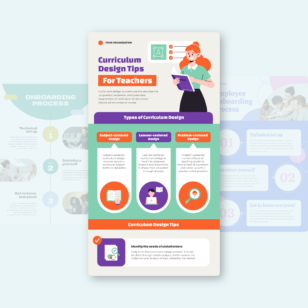
Infographics
Visualize complex processes or clearly explain topics with high-quality infographics. Perfect for educational content, business reports, and marketing materials.
👁 Image
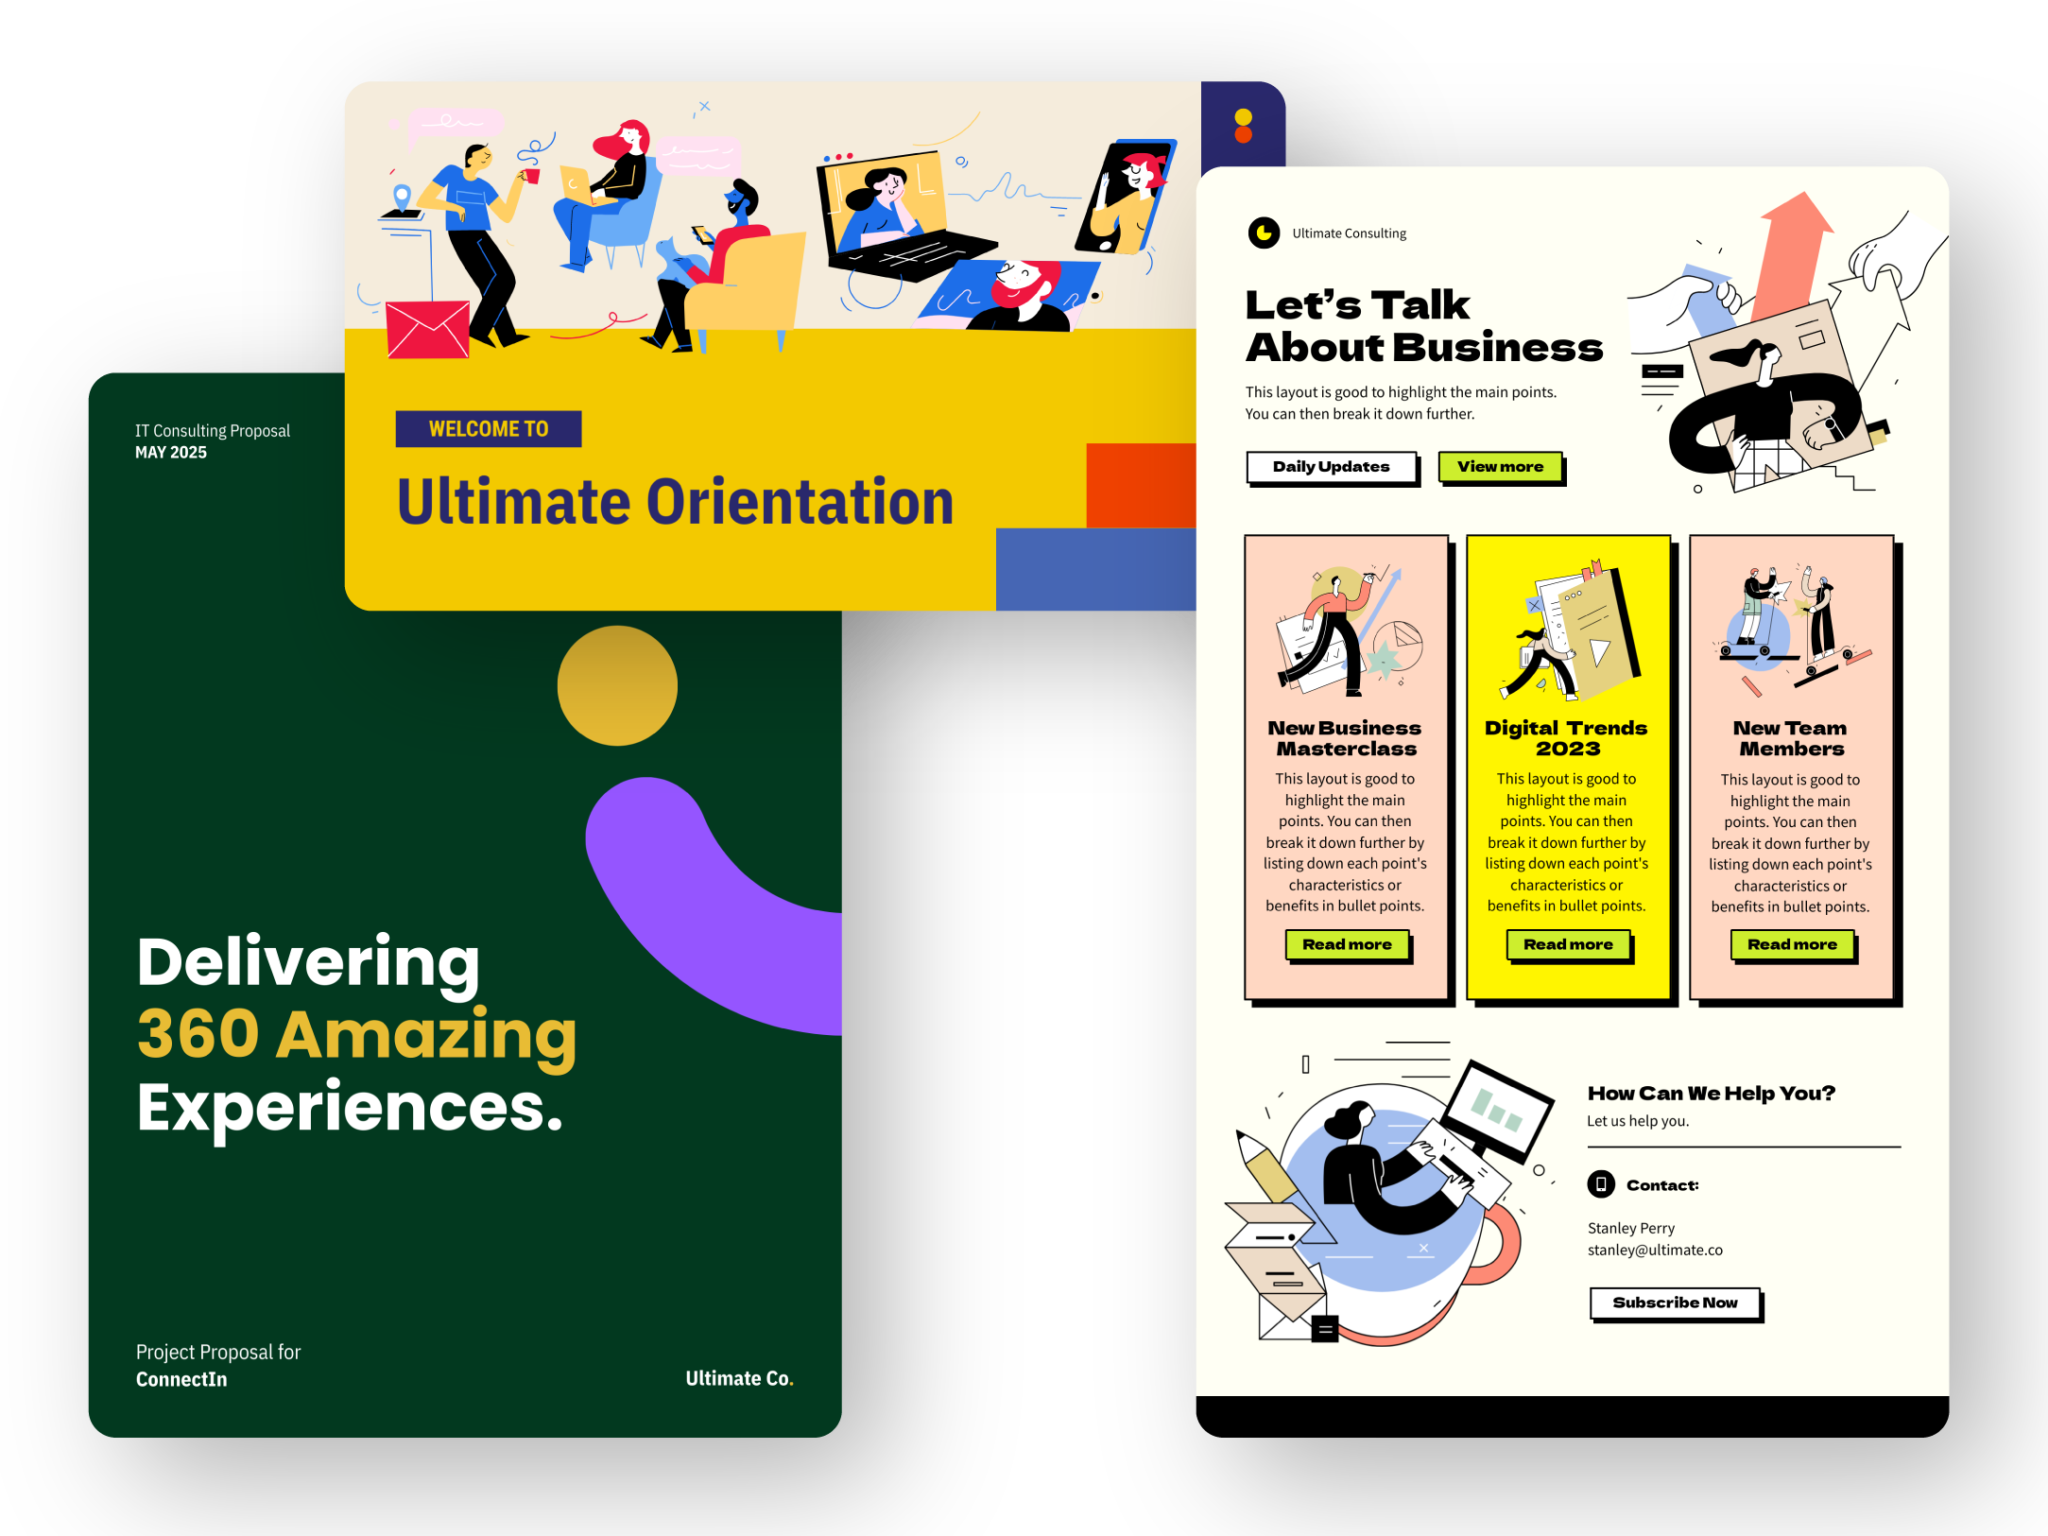
Documents
Create insightful documents like reports, newsletters, and schedules that transform mundane data into compelling stories.
👁 Image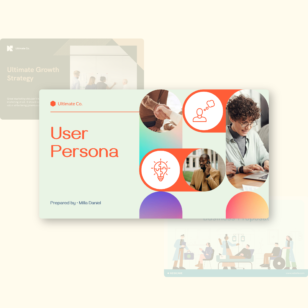
Presentations
Create a professional-looking pitch deck, sales deck, or an engaging presentation for business or school.
👁 Image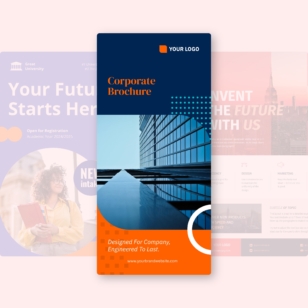
Print materials
Create impactful print materials, including posters, banners, and brochures that capture attention and convey your message effectively.
👁 Image
Social media graphics
Create eye-catching social media graphics for Facebook, X, LinkedIn, Instagram, and more platforms to drive engagement and elevate online presence.
👁 Image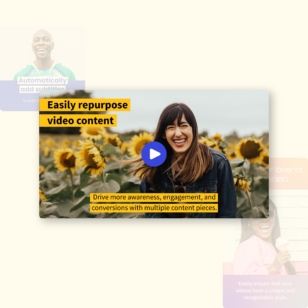
Videos
Repurpose your webinars, Zoom recordings, and thought leadership videos into captivating social media videos.
Create visually compelling and easily understandable visuals to enhance your messaging – whether internally or externally.
Create visuals for communications
Present complex data and insights through clear visuals that make your proposal more persuasive.
Create visuals for consulting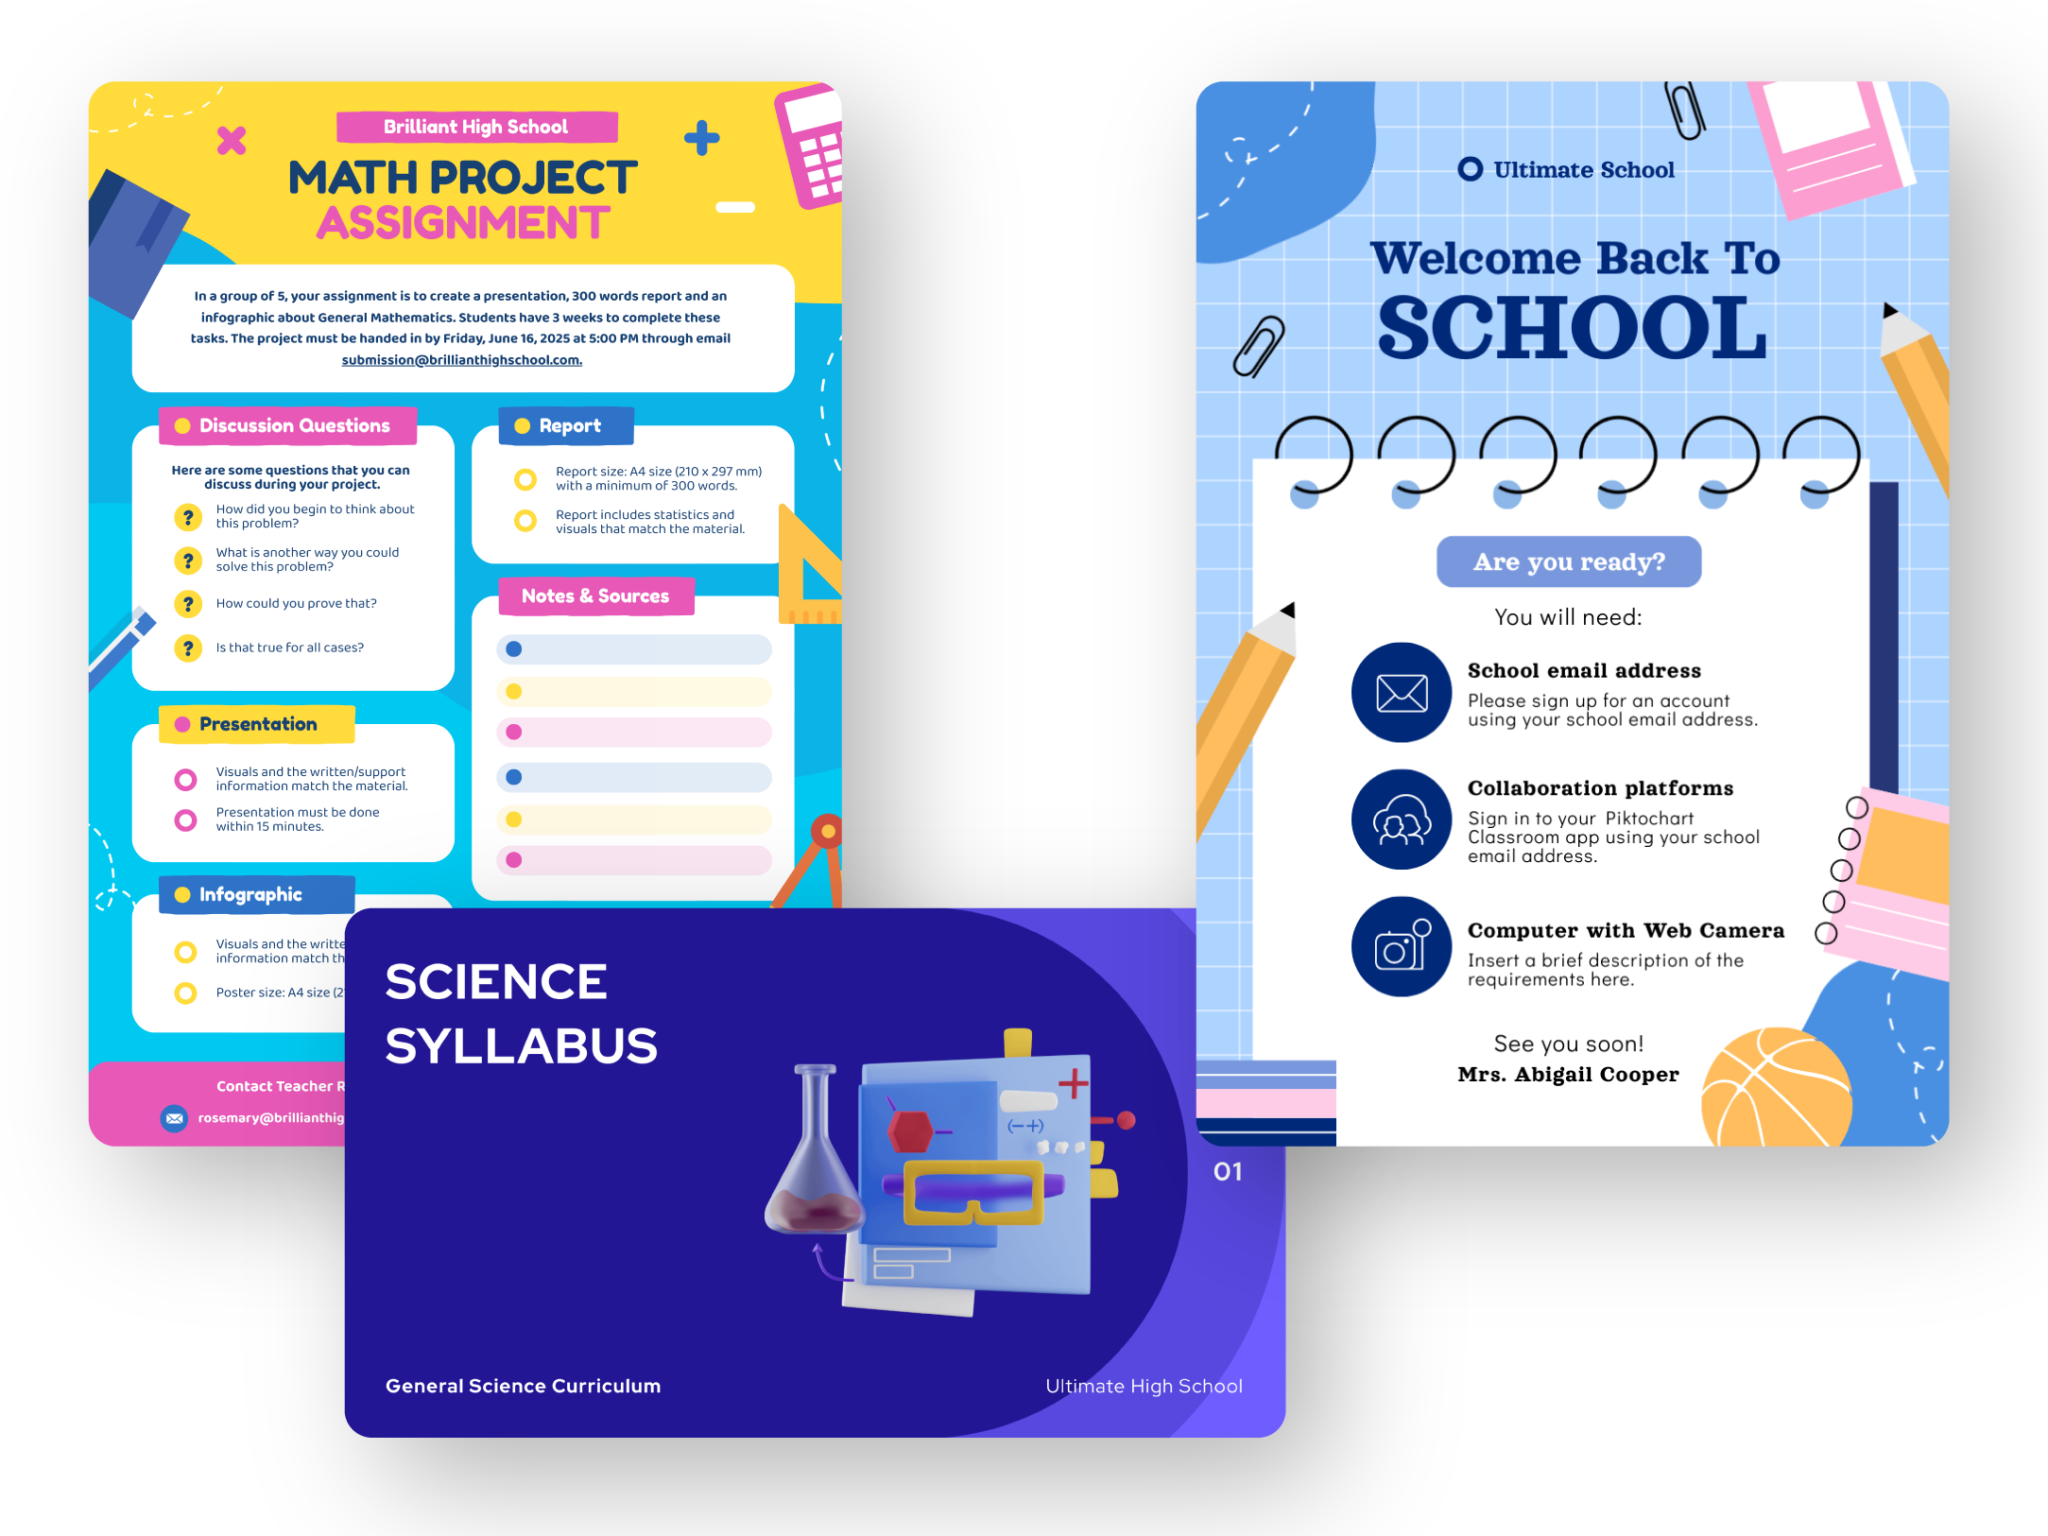
Design engaging visual aids and educational materials that can simplify complex concepts for students.
Create visuals for educators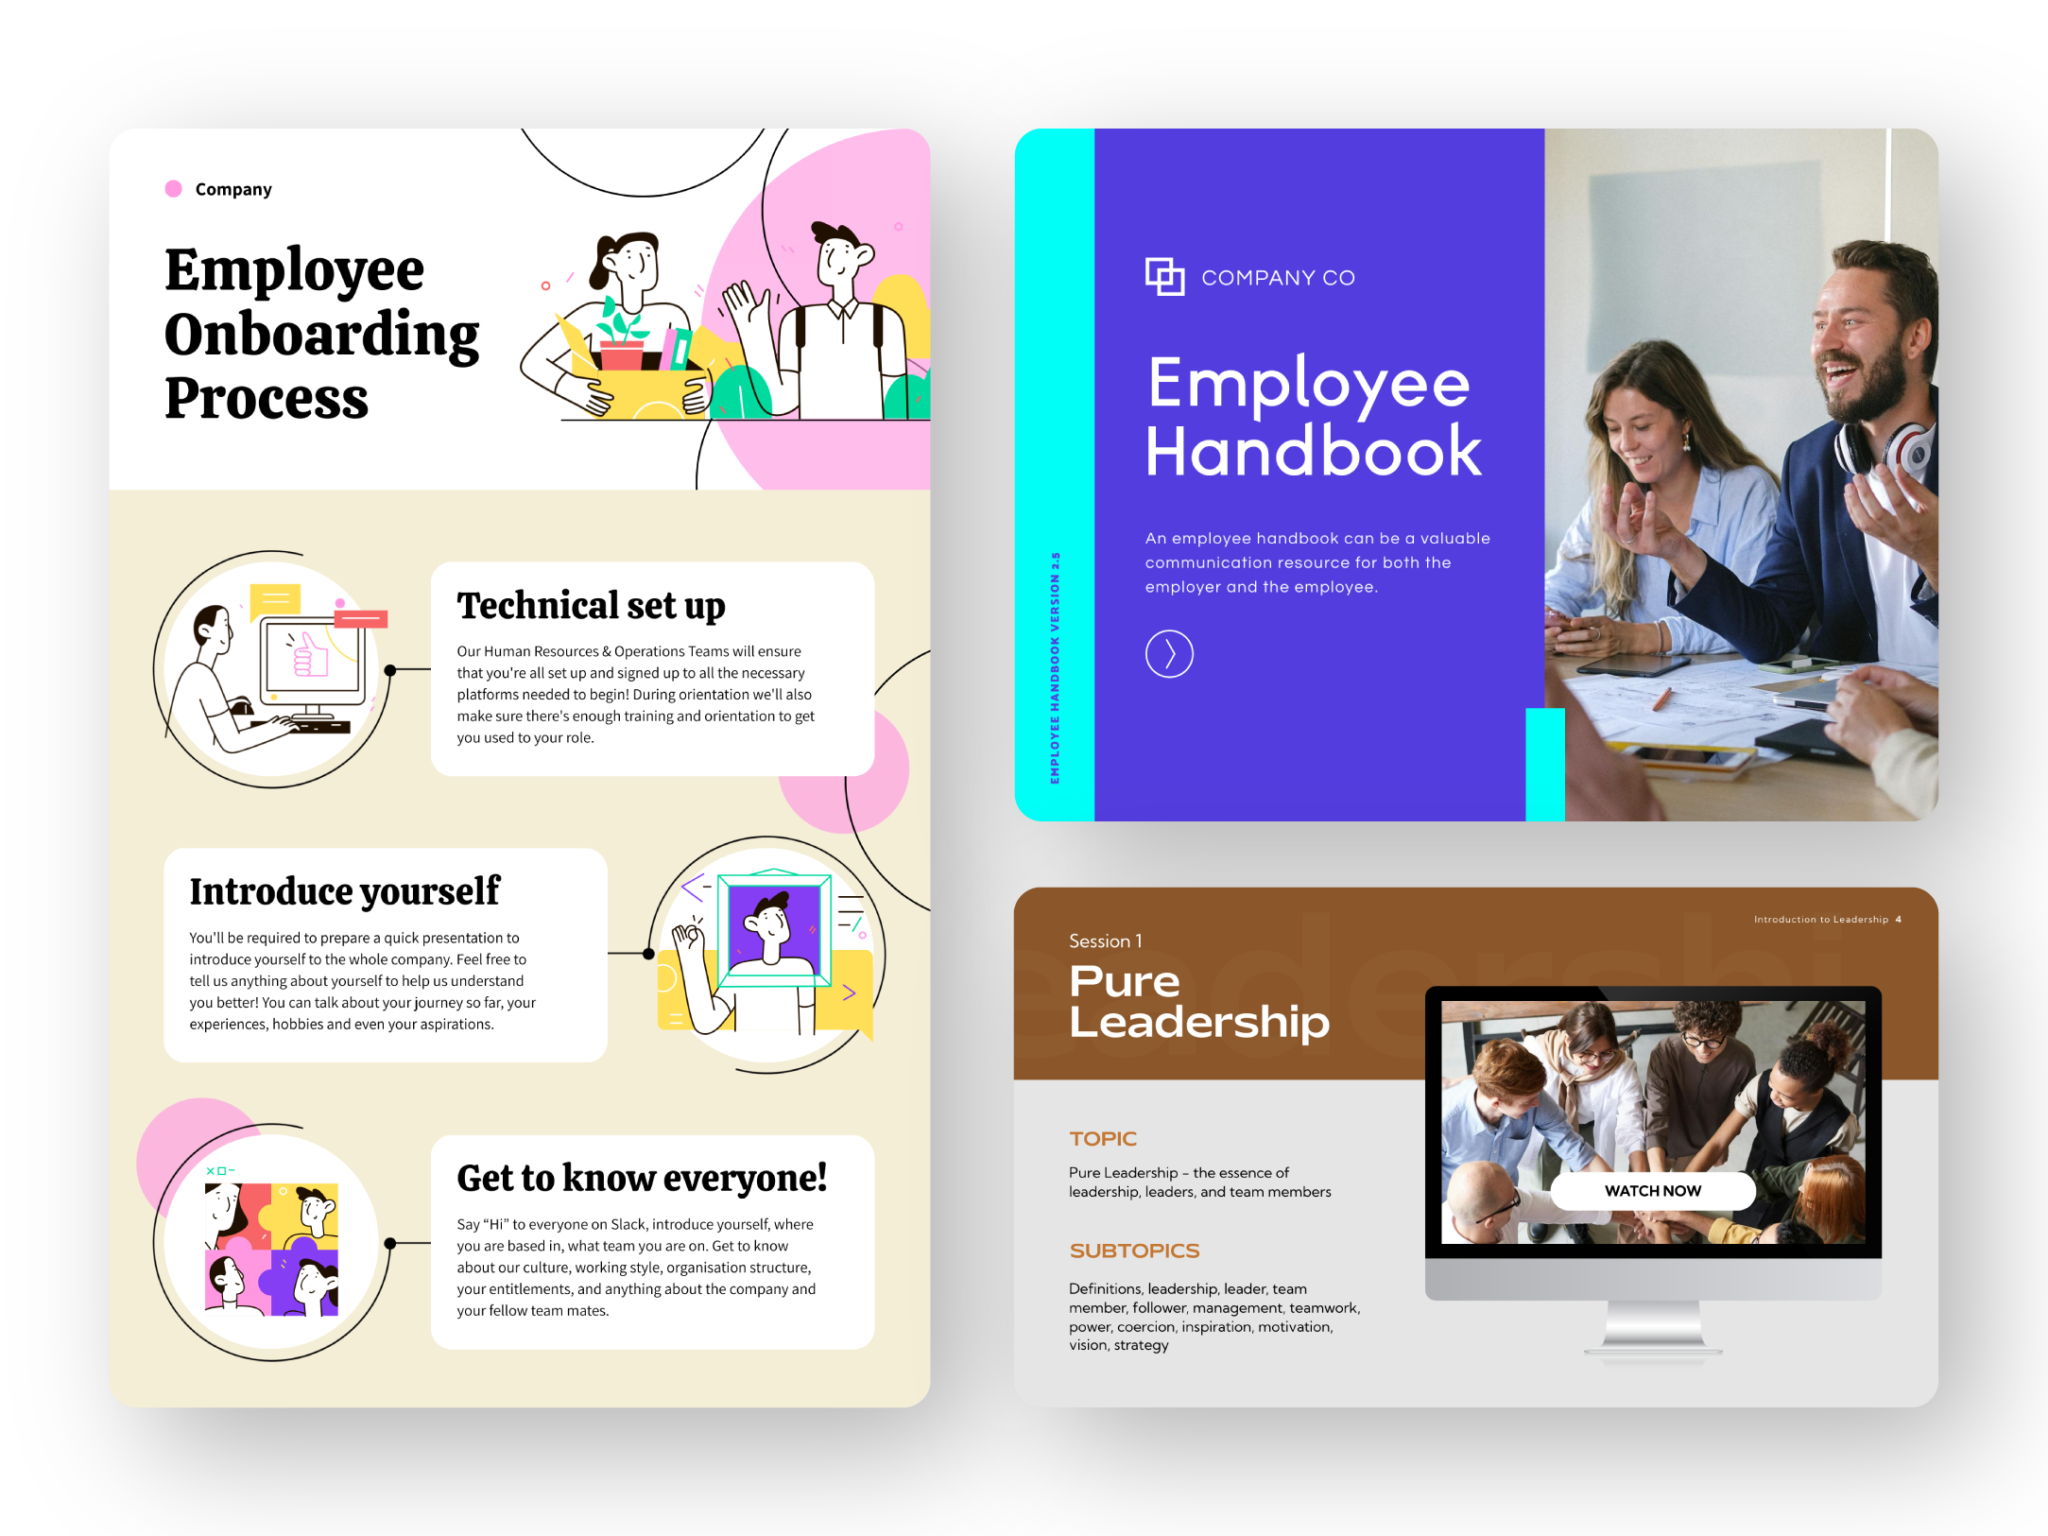
Visualize key metrics, such as employee engagement and performance data, making it easier to communicate these insights across the organization.
Create visuals for HR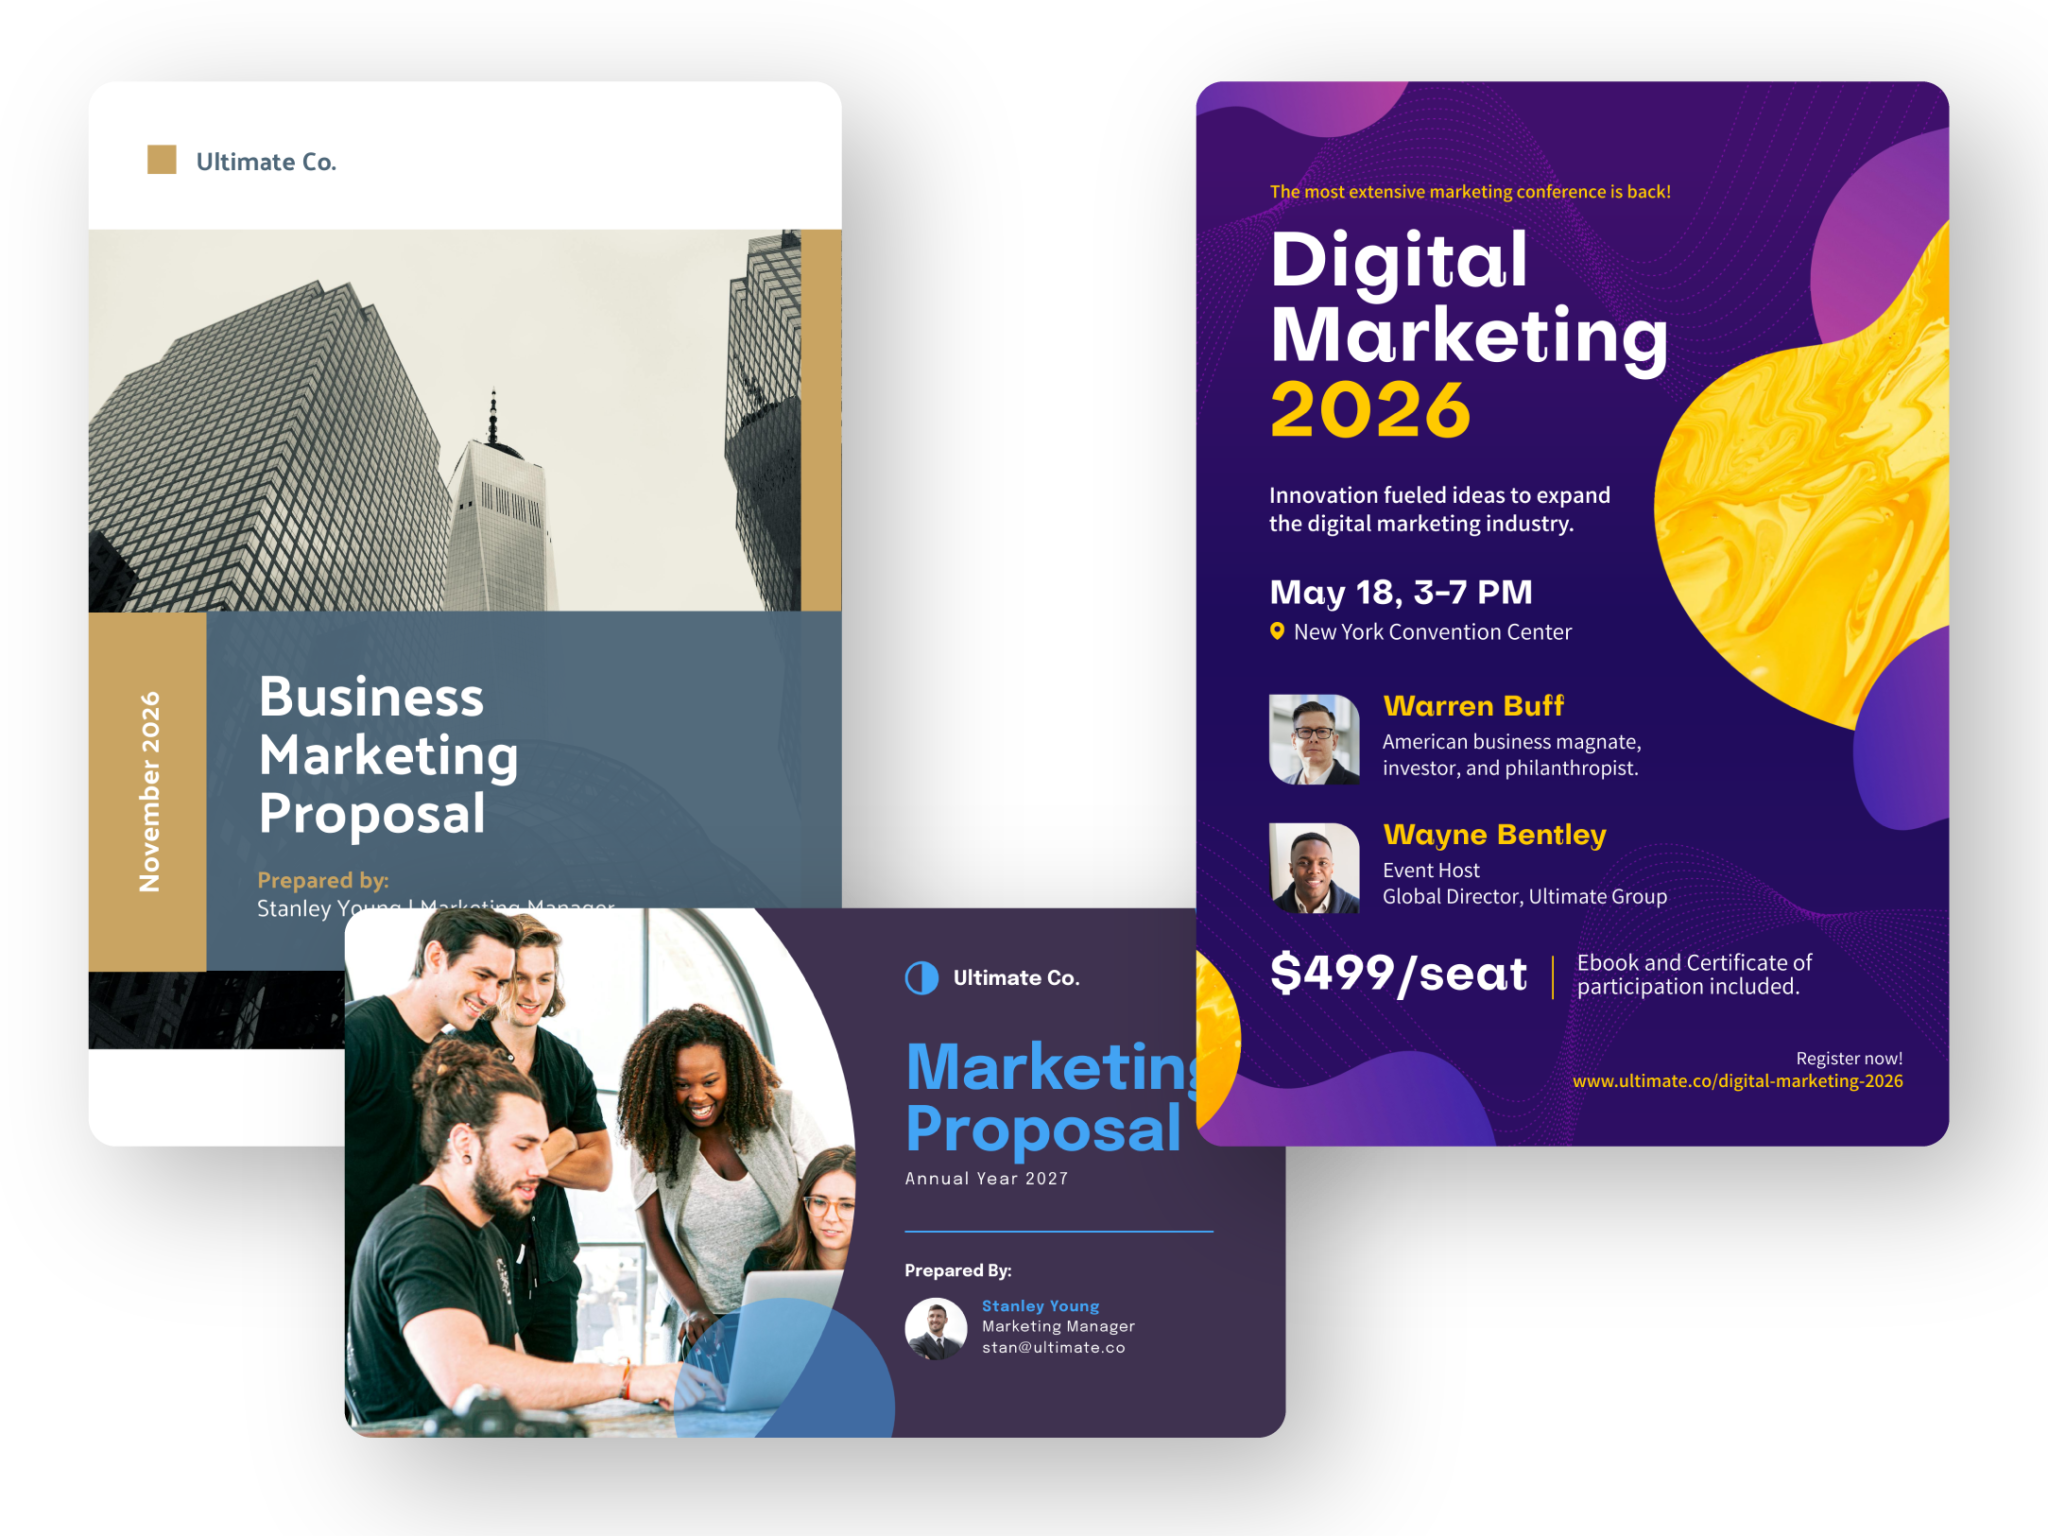
Create eye-catching visuals that can effectively convey marketing strategies and campaign results to stakeholders.
Create visuals for Marketing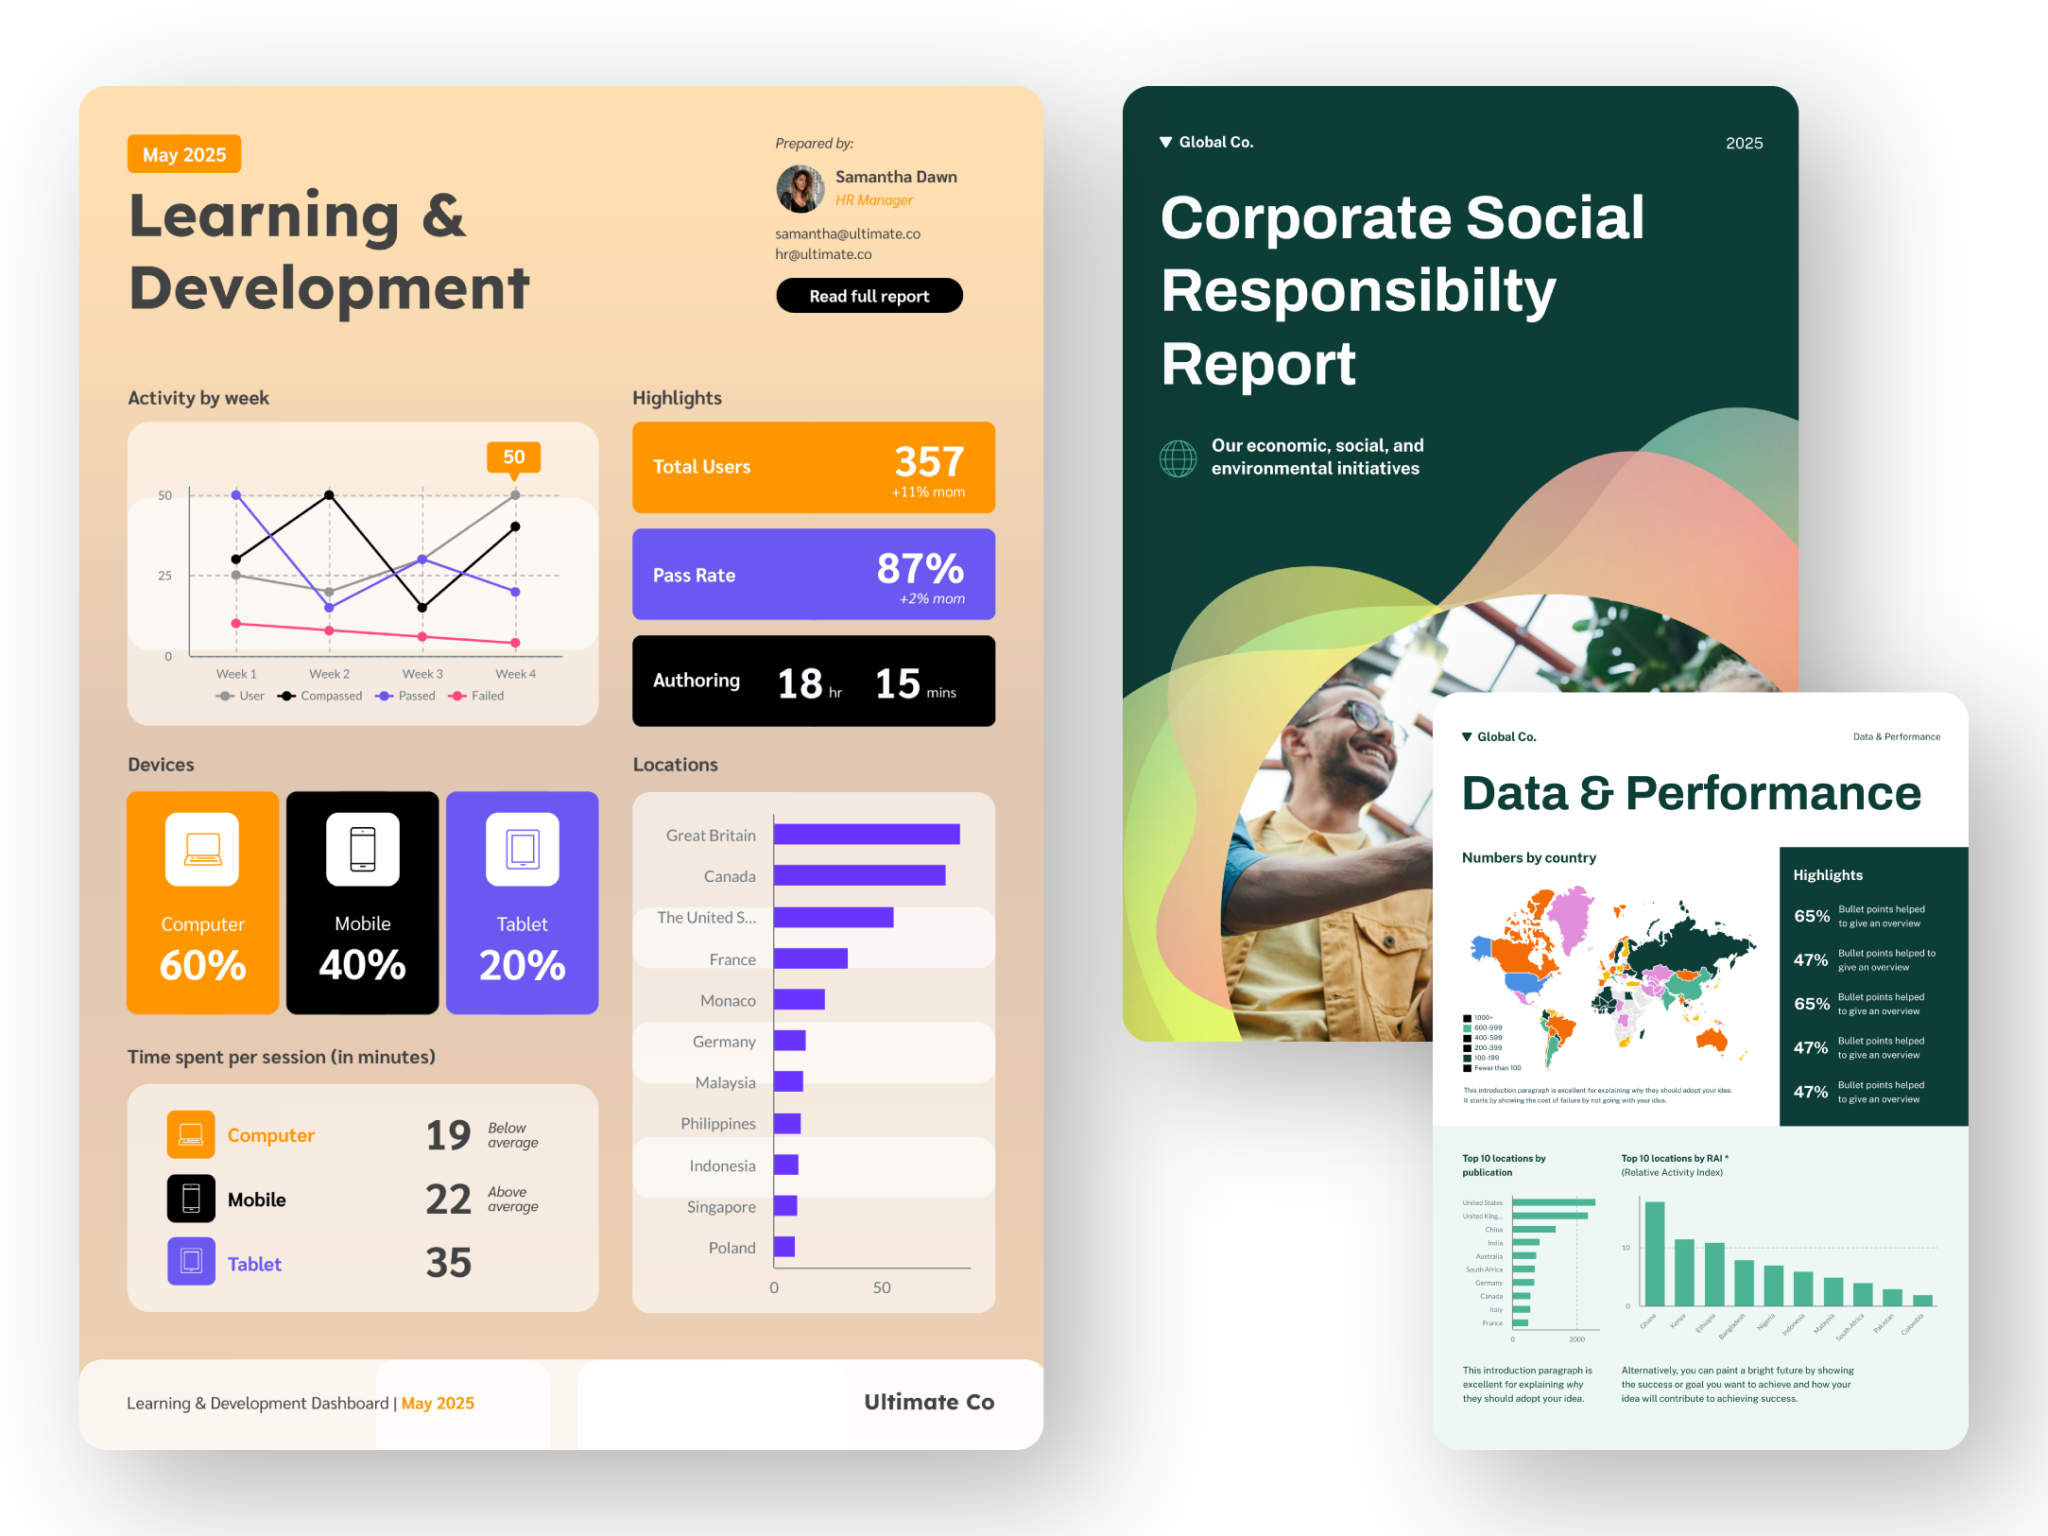
Transform raw data into polished, professional reports that are both informative and visually appealing.
Create visuals for Reporting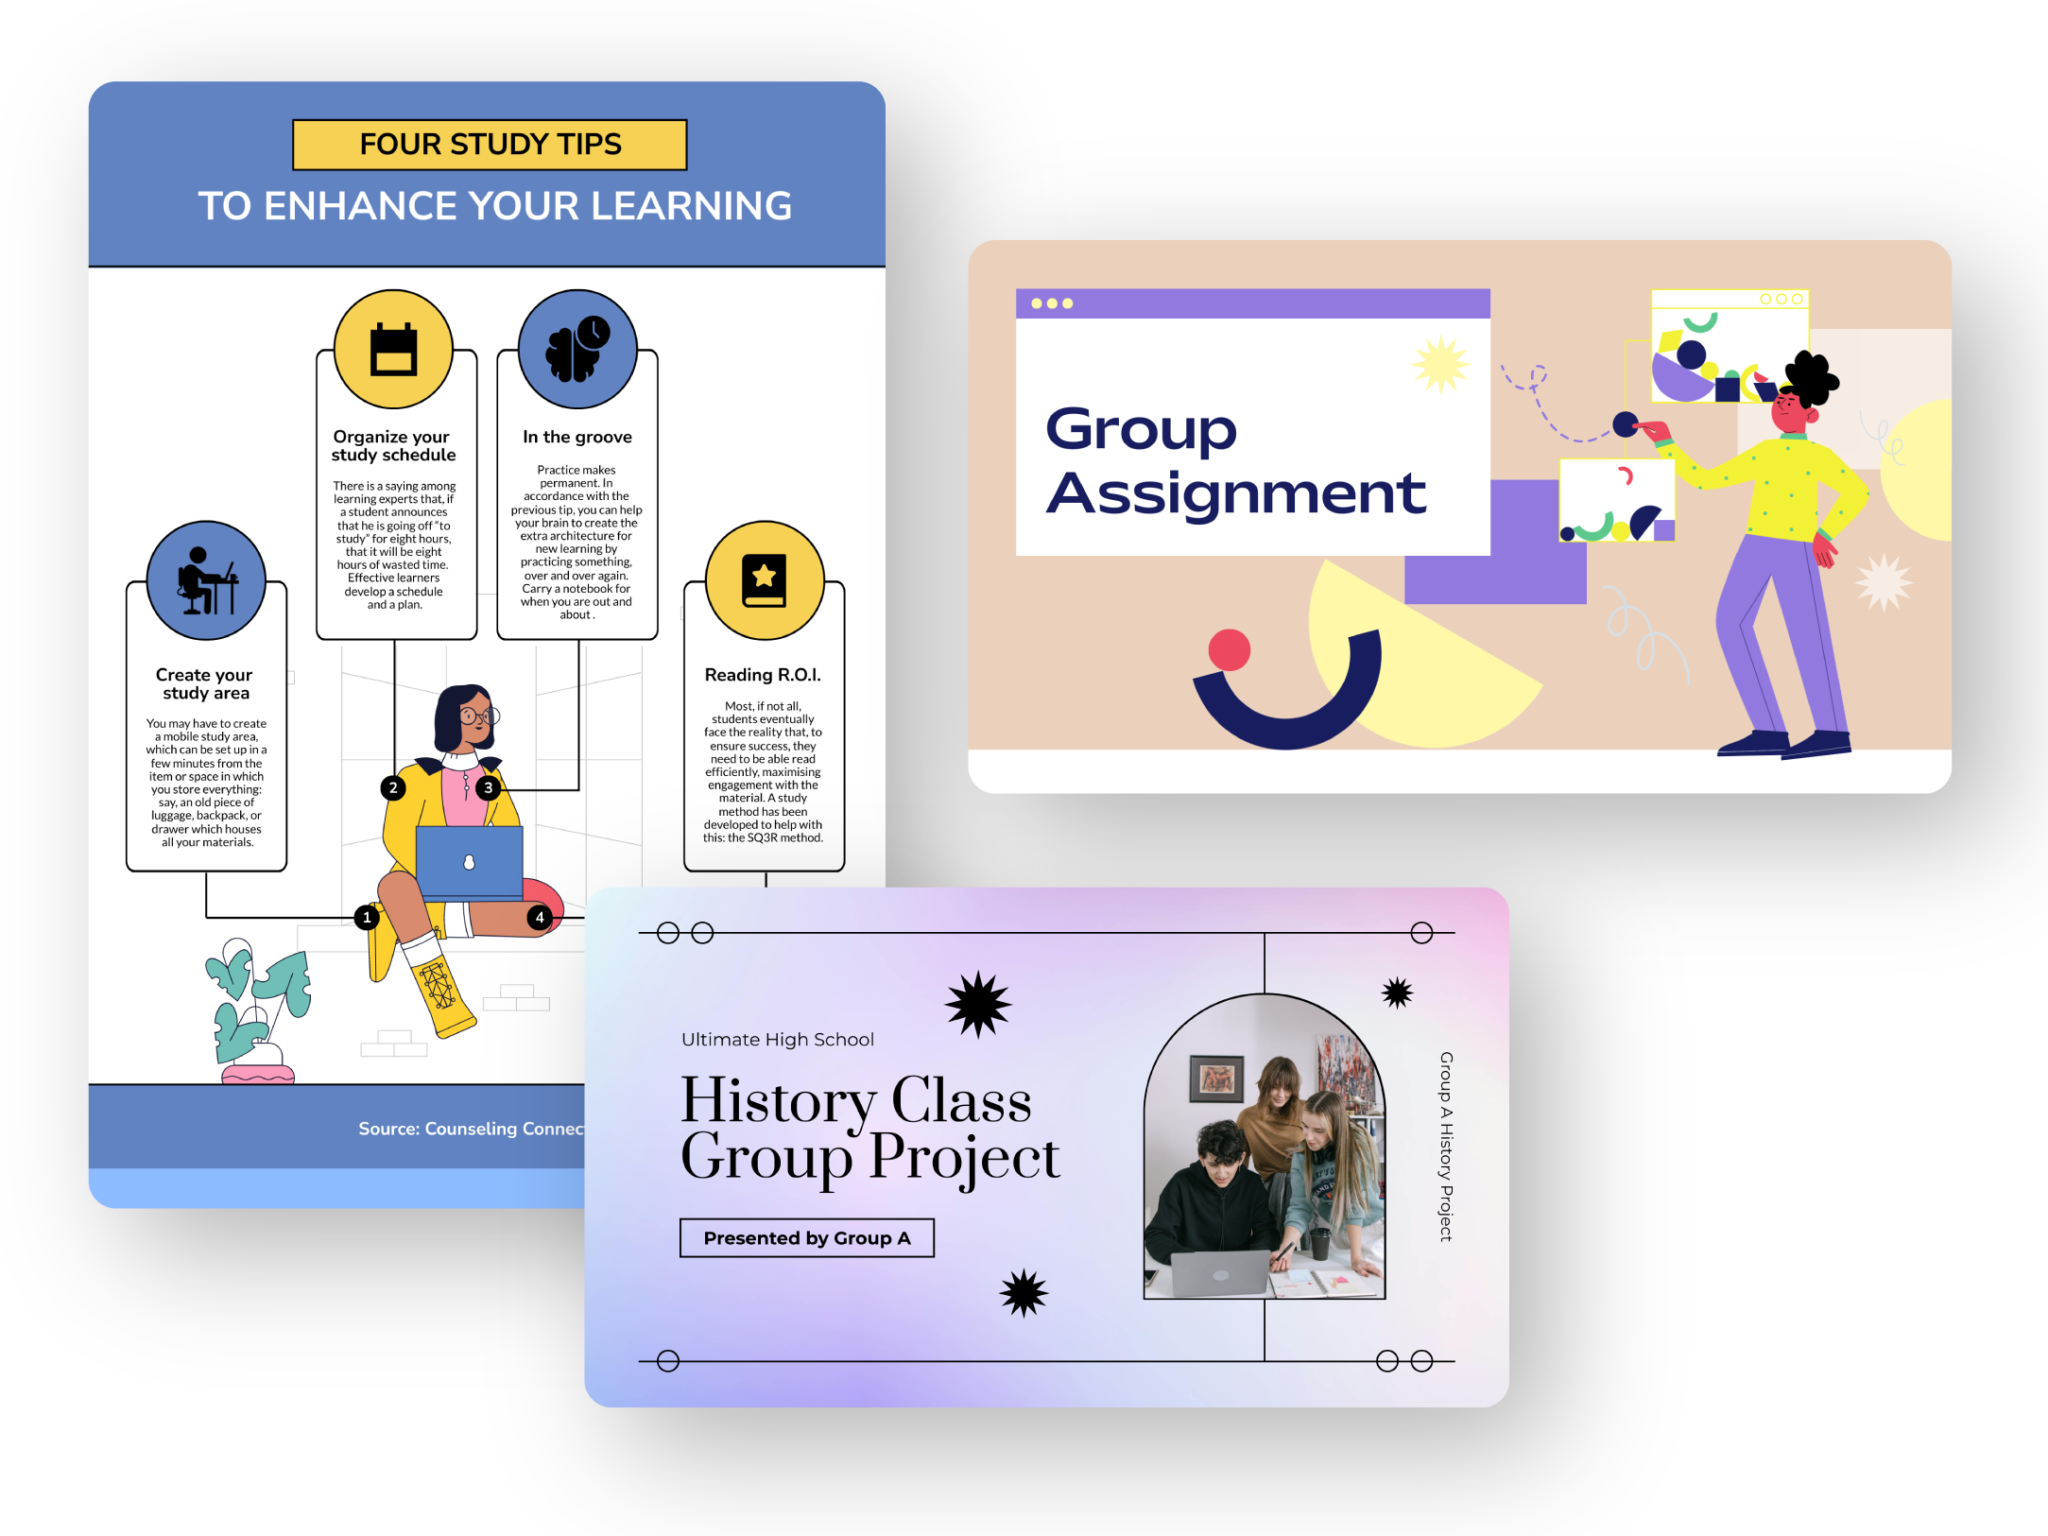
Stand out with professional-quality visuals for school presentations or course assignments.
Create visuals for Students
It’s a pretty hard task when you’re trying to take 500 words and put them into one image. We found Piktochart as a solution to help convey information in an engaging manner. I can’t tell you how many times I’ve been in important meetings and if I didn’t have visual communication to talk about the impact of the work, I’m convinced that I would not be able to have secured funding to support the work that we do.
Dr. Aaron FischerDee Endowed Professor of School Psychology at University of Utah
Piktochart has been beneficial in my classes where I teach 9th and 12th graders. When there are more difficult concepts or when we’re doing something that’s just not that interesting, Piktochart gets the kids to stay more engaged for a longer period of time. Plus with the way Piktochart’s interface is set up, I can hyperlink things and can make designs function in different ways.
Jamie BarkinEnglish and AP Literature Teacher at Wheaton High School
Piktochart has really changed the way that we look and operate as a business and being a small consulting firm, we’re competing in spaces with some of the big time professional firms who have full out graphic shops. And what we can produce now rivals what they produce. Piktochart is kind of my best kept secret. We were paying a lot of money to get this caliber of graphic support prior to Piktochart. Now we’ve eliminated all that cost and a fraction of the time.
Lloyd ParkerVice President Programs & Solutions at T. White Parker Associates
For a small startup trying to make a big impact in Barcelona, having platforms like Piktochart in our toolkit is essential. Since day one of our operations, we’ve used it to get our message across, build awareness about the plastic problem and our solution to it, and pitch to investors. We landed strategic partnerships thanks to powerful visual storytelling and pitch decks that spoke more than words.
Marta OlszewskaCo-Founder and CEO at Refill Aqua