 |
VOOZH | about |
|
VOOZH | about |
The Replay is a weekly newsletter for dev and engineering leaders.
Delivered once a week, it's your curated guide to the most important conversations around frontend dev, emerging AI tools, and the state of modern software.
Developers have an impressive list to choose from when it comes to selecting a JavaScript framework for developing web applications. Each of these frameworks has unique strengths and weaknesses. For Vue, one of its strengths lies in the robustness of its DevTools.
👁 ImageJavaScript developers switching to a new framework may be tempted to use general hacks (such as logging around) while debugging their applications at runtime — while this isn’t bad, it’s more efficient to use tools specific to that framework as they offer more specialized functions.
In this article, we will take a look at the Vue DevTools and see how it can be used to manipulate Vue applications at runtime for a better debugging experience.
You need to have the following tools installed on your machine to follow this tutorial:
There are basically three ways to install the Vue DevTools:
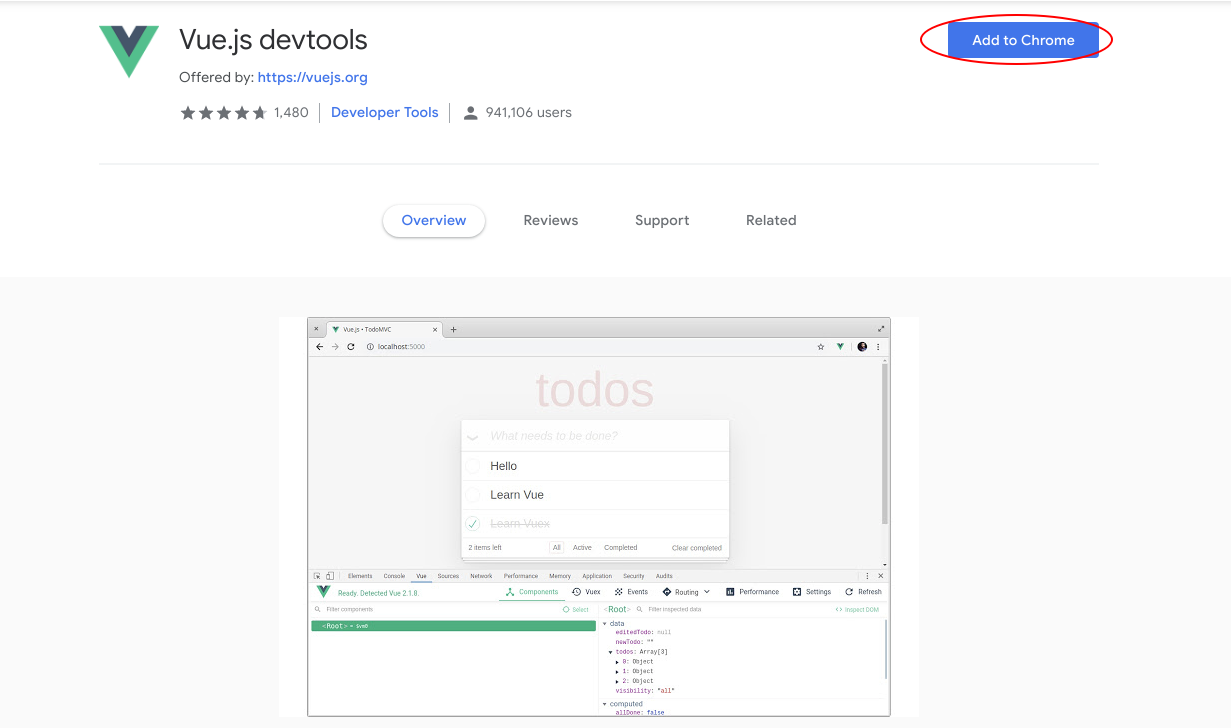
From the list above, we can see that the DevTools is only available (as stated on the official repository) as a custom extension for Chrome and Firefox browsers. Other browsers’ users would have to install the standalone application locally on their machines.
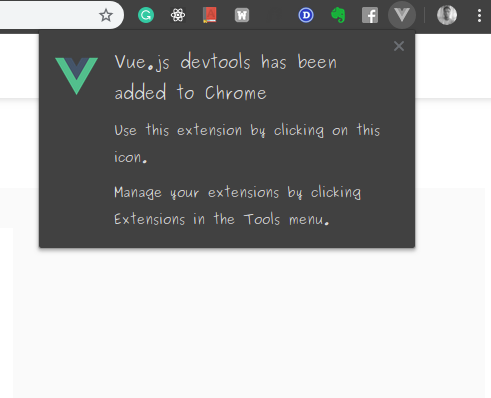
This will add the Vue DevTools as a Chrome extension and show a confirmation notification:
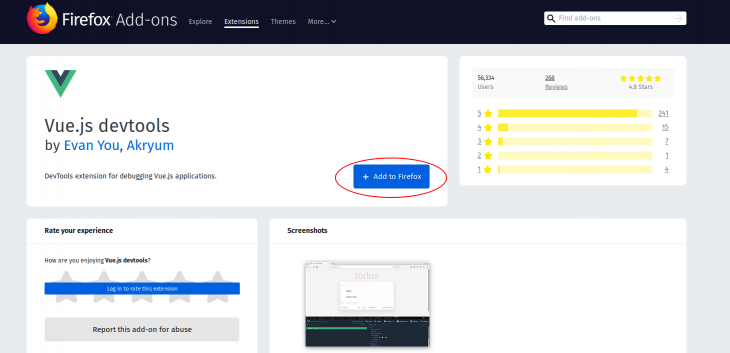
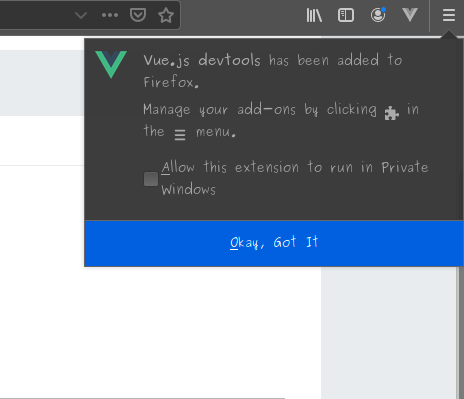
This will add the Vue DevTools as a Firefox extension and show a confirmation notification:
Run this command to globally (using Npm) install Vue Devtools as a standalone application:
npm install -g @vue/devtools
Or locally as a project dependency:
npm install --save-dev @vue/devtools
We can also install it globally using Yarn:
yarn global add @vue/devtools
Once the installation is complete, we can start the application with this command:
vue-devtools
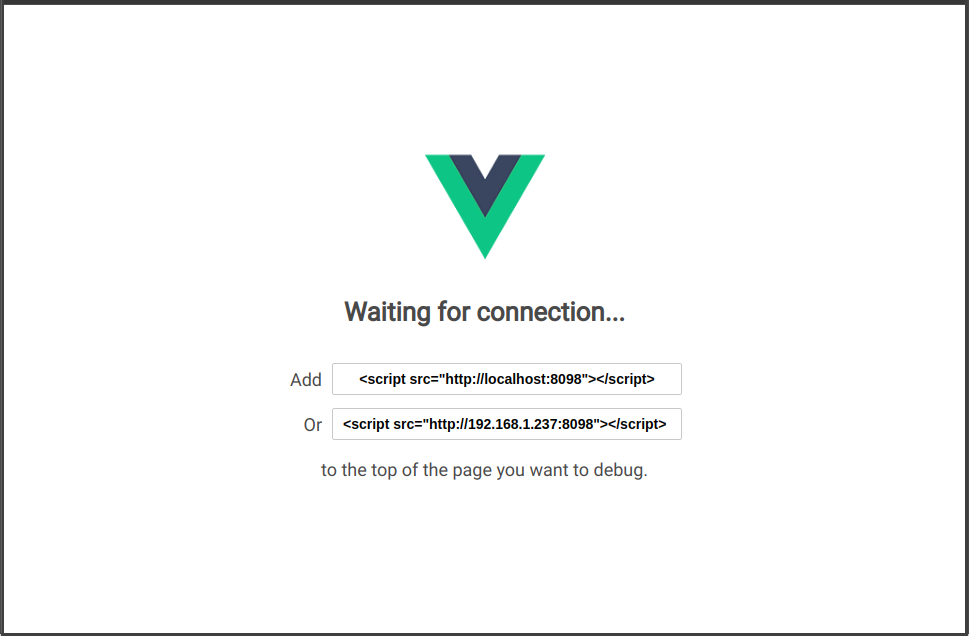
This would open the standalone application and you would need to add this link to your application’s index.html file:
<script src="http://localhost:8098"></script>
And wait for the standalone application to be reloaded — it will automatically connect to your Vue application.
Vue DevTools makes it easy to debug Vue applications at runtime, we are going to look at five ways we can use the DevTools plugin for debugging.
When building your components with Vue, you might want to try out a variety of component values or manipulate component data in realtime. Updating the data items in your IDE then going to the browser to see the results just doesn’t cut it anymore.
Vue DevTools allows you to edit component data in realtime:
Tip: You can launch Chrome DevTools by hitting – CTRL + SHIFT + I (CMD for Mac)
By default, prop data is not editable but we can make it editable by enabling it in the settings tab.
With this feature, you can edit all data types, toggle Boolean values, and manipulate array values. You can also manipulate data from a remote API. As long as the data has been loaded into the Vue application, it is completely accessible for realtime editing.
Vue DevTools allow you to load the HTML of custom components in the DOM. This is very useful for debugging the UI of your application. To load component data in the DOM, navigate to the click the Inspect DOM option under the components tab:
Just beside the Inspect DOM option is the Open in editor option and it opens the selected component in your default editor. Nice!
You can track custom events (events that you emit using this.$emit('customEvent')) using the DevTools. This allows you to see if your events are triggered correctly and inspect the payload they carry.
To track custom events, do the following:
When building a SPA application with Vue, you might want to debug your routes or keep track of the overall navigation flow in realtime. Vue DevTools has a Routing tab that logs your route data and history as your application transitions from route to route.
The routing tab has two options:
To use the Routing tab, do the following:
👁 monitor routes and history data
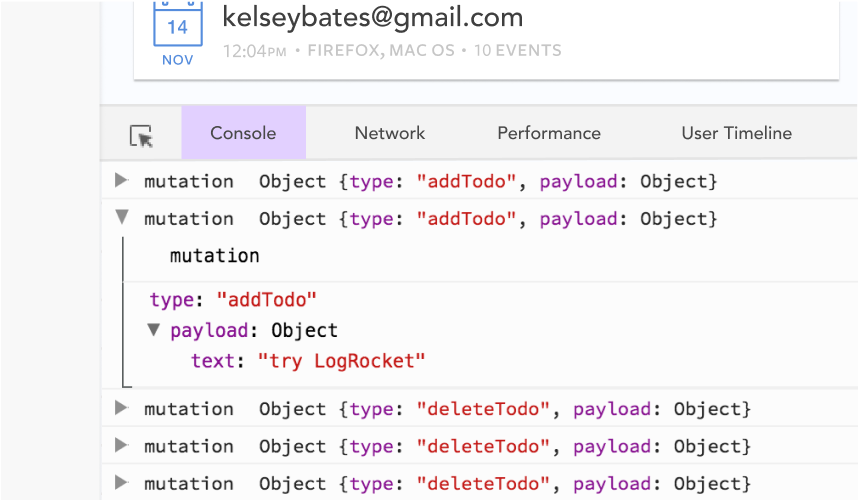
Vuex is a state management library for Vue that allows you to manage and mutate your application’s state in a predictable way. The Vue DevTools lets you inspect state in realtime for debugging purposes.
Vue Devtools has a Vuex tab that logs your state whenever Vuex dispatches a mutation. This simplifies the process of debugging your state if it ever starts acting in an unpredictable manner. There is also a feature that lets you time travel through previous versions of your Vuex state in realtime.
Here’s the time travel debugging feature in action:
Being a web developer keeps getting better by the day. With the availability of modern tools that simplify the development process, it is beneficial for developers to harness these tools for a faster and more efficient workflow.
In this article, we’ve explored five ways to use the Vue DevTools for quicker and more efficient debugging. I hope that you take advantage of these features and have a better debugging experience with your Vue applications.
Debugging Vue.js applications can be difficult, especially when users experience issues that are difficult to reproduce. If you’re interested in monitoring and tracking Vue mutations and actions for all of your users in production, try LogRocket.
👁 LogRocket Dashboard Free Trial BannerLogRocket lets you replay user sessions, eliminating guesswork by showing exactly what users experienced. It captures console logs, errors, network requests, and pixel-perfect DOM recordings — compatible with all frameworks.
With Galileo AI, you can instantly identify and explain user struggles with automated monitoring of your entire product experience.
Modernize how you debug your Vue apps — start monitoring for free.
Build dynamic LLM routing in Next.js with OpenRouter, TanStack AI, task classification, model fallbacks, and cost-aware routing.
TSRX adds first-class control flow, conditional hooks, and scoped styles to React via a TypeScript compiler extension — no new framework required.
Learn how to build a full React Native auth system using Better Auth and Expo — with email/password login, Google OAuth, session persistence, and protected routes.
Compare the top AI development tools and models of June 2026. View updated rankings, feature breakdowns, and find the best fit for you.
Would you be interested in joining LogRocket's developer community?
Join LogRocket’s Content Advisory Board. You’ll help inform the type of content we create and get access to exclusive meetups, social accreditation, and swag.
Sign up now