 |
VOOZH | about |
|
VOOZH | about |
AI coding agents like Claude Code, Cursor, and Cline have become useful static analyzers. They can read source files, suggest refactors, generate boilerplate, and explain code paths with impressive accuracy. What they still struggle with is the thing frontend developers debug every day: the running browser.
👁 Debug Next.js apps with AI agents and next-browserWhen a component renders the wrong value, a hydration mismatch appears in the console, or a responsive layout breaks at one viewport, the agent usually has to infer what happened from source code alone. That is a weak feedback loop. The human sees the browser; the agent sees files.
next-browser helps close that gap for Next.js apps. It exposes browser and React runtime information through terminal commands, including the React component tree, component props, hooks, accessibility snapshots, browser logs, network requests, screenshots, Core Web Vitals, hydration timing, and Partial Prerendering diagnostics.
This guide walks through how to use next-browser as an AI-agent debugging tool. We will cover installation, the core command model, and six practical debugging scenarios: inspecting component props, capturing loading skeletons, auditing server-rendered output, testing form flows, profiling Core Web Vitals, and comparing responsive layouts.
For a broader look at agent-controlled browser automation, see LogRocket’s guide to Agent Browser and AI agents on the web.
The Replay is a weekly newsletter for dev and engineering leaders.
Delivered once a week, it's your curated guide to the most important conversations around frontend dev, emerging AI tools, and the state of modern software.
To follow along, you need:
pnpm, npm, or Yarnhttp://localhost:3000AI coding agents operate primarily through the terminal. They read files, run commands, and parse output, but they do not naturally have the same browser context a developer has when looking at DevTools.
Terminal-first inspection gives the agent a structured way to ask the running app what is happening. Instead of asking a human to describe a screenshot or paste console output, the agent can run a command and receive parseable information about the current page.
Three design choices make next-browser practical for agent workflows:
| Design choice | Why it matters |
|---|---|
| Persistent browser daemon | A long-lived Chromium session stays connected between commands, so the agent does not need to launch a new browser for every question. |
| One-shot commands | Each command returns plain text the agent can parse, then use to decide the next step. |
| React and Next.js awareness | The agent can inspect component trees, props, hooks, logs, PPR boundaries, and hydration timing instead of relying only on raw DOM output. |
That difference is important. A DOM snapshot can tell the agent what is on the page. The React tree can tell it which component produced that output and what props or state it had at runtime.
At a high level, next-browser gives agents command-line access to the browser, React DevTools, and Next.js diagnostics.
| Capability | Useful commands | What the agent can inspect |
|---|---|---|
| Component inspection | tree, tree <id> |
React component hierarchy, props, hooks, state, keys, and source locations |
| Page inspection | snapshot, screenshot |
Accessibility tree, interactive element references, and screenshots |
| Runtime debugging | browser-logs, errors, logs, network |
Console output, build/runtime errors, dev server logs, and network requests |
| User interaction | click, fill, goto, push, back, viewport |
Real page interactions and navigation flows |
| Performance analysis | perf |
Core Web Vitals and React hydration timing |
| Rendering diagnostics | ssr lock, ppr lock, ppr unlock |
Server-rendered output, static shells, and dynamic PPR boundaries |
This makes next-browser especially useful for problems that static analysis cannot reliably solve: hydration mismatches, incorrect runtime props, Suspense fallbacks, form state, responsive regressions, and layout shifts.
The fastest setup is to add next-browser as an agent skill from your Next.js project:
npx skills add vercel-labs/next-browser
You can also install the CLI globally for manual use:
pnpm add -g @vercel/next-browser
playwright install chromium
Then start a session against your local dev server:
next-browser open http://localhost:3000
This launches a persistent Chromium browser with React DevTools and Next.js inspection hooks available to the CLI. Subsequent commands reuse the same session.
Before moving into a full workflow, here are three common commands that show where next-browser is most useful.
In a complex Next.js app, data can pass through Server Components, Client Components, context, loaders, and Server Actions. Static analysis can show where values might come from, but it cannot always tell you what a component actually received at runtime.
If a PriceDisplay component shows $0.00 instead of the expected value, you can start with the component tree:
next-browser tree
Then inspect a specific component by ID:
next-browser tree 38205
The agent can now see the live props and state for that component, not just the source file. This is especially useful when debugging data boundaries in React Server Components; LogRocket’s guide to React Server Component performance pitfalls in Next.js covers several ways these boundaries can become hard to reason about.
Hydration mismatches are difficult because the failure can happen before the app becomes fully interactive. By the time a developer inspects the page manually, the useful evidence may already be gone.
If the browser console reports a text-content mismatch, run:
next-browser browser-logs
next-browser snapshot
next-browser tree
The agent can compare the browser logs, accessibility snapshot, and React tree in one pass. That gives it more context than a source-only review. For more background, see LogRocket’s article on resolving hydration mismatch errors in Next.js.
Partial Prerendering is powerful, but a misplaced request-time API such as headers() or cookies() can move part of a route out of the static shell. next-browser can inspect those boundaries directly:
next-browser ppr lock
This freezes dynamic content so the agent can inspect the static shell. Anything that disappears was treated as dynamic. Then unlock PPR to see the shell analysis:
next-browser ppr unlock
If the report shows that SideNav triggered a dynamic hole because of a cookie check, the agent can suggest moving that request-dependent logic into a smaller scoped component. For a deeper introduction, see LogRocket’s guide to Partial Prerendering in Next.js.
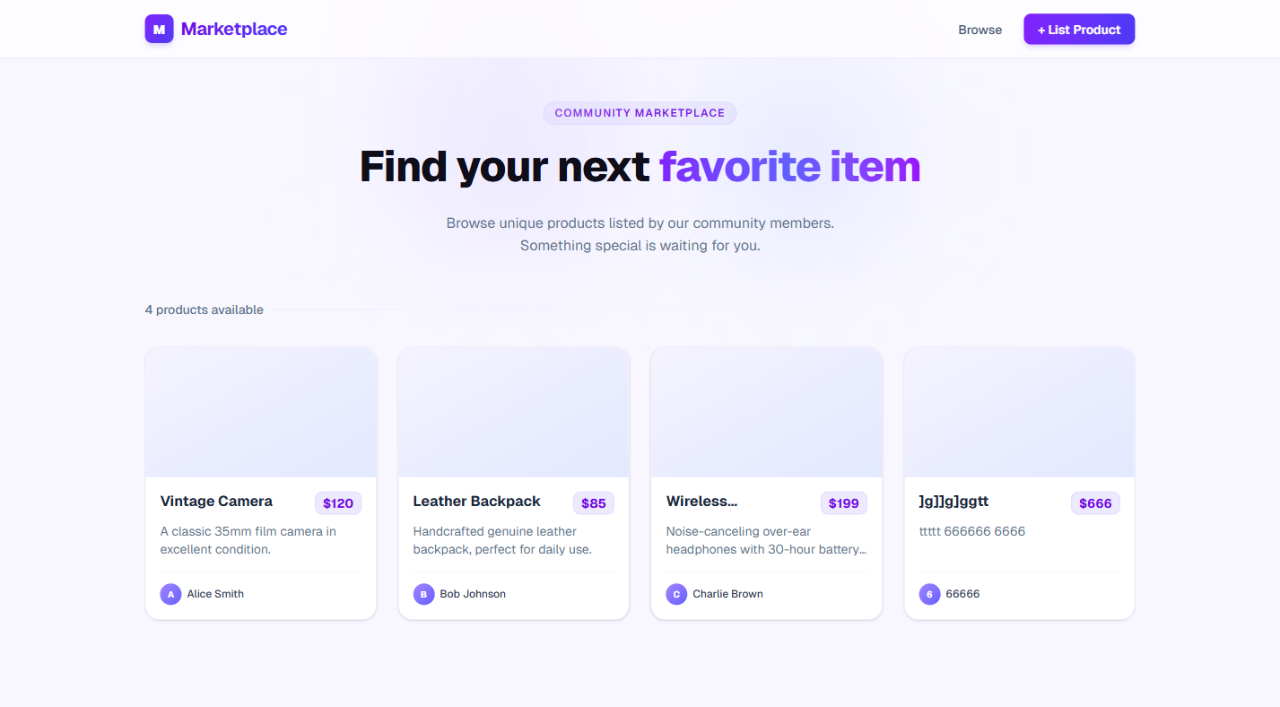
To test these capabilities, I ran next-browser against a small Next.js product listing app. The app uses the App Router and includes:
ProductCard grid/list route with an add-product formThe app is intentionally simple so the output stays readable, but it covers the runtime problems that show up in larger production applications: component data contracts, visual states, server-rendered output, navigation, network activity, and performance.
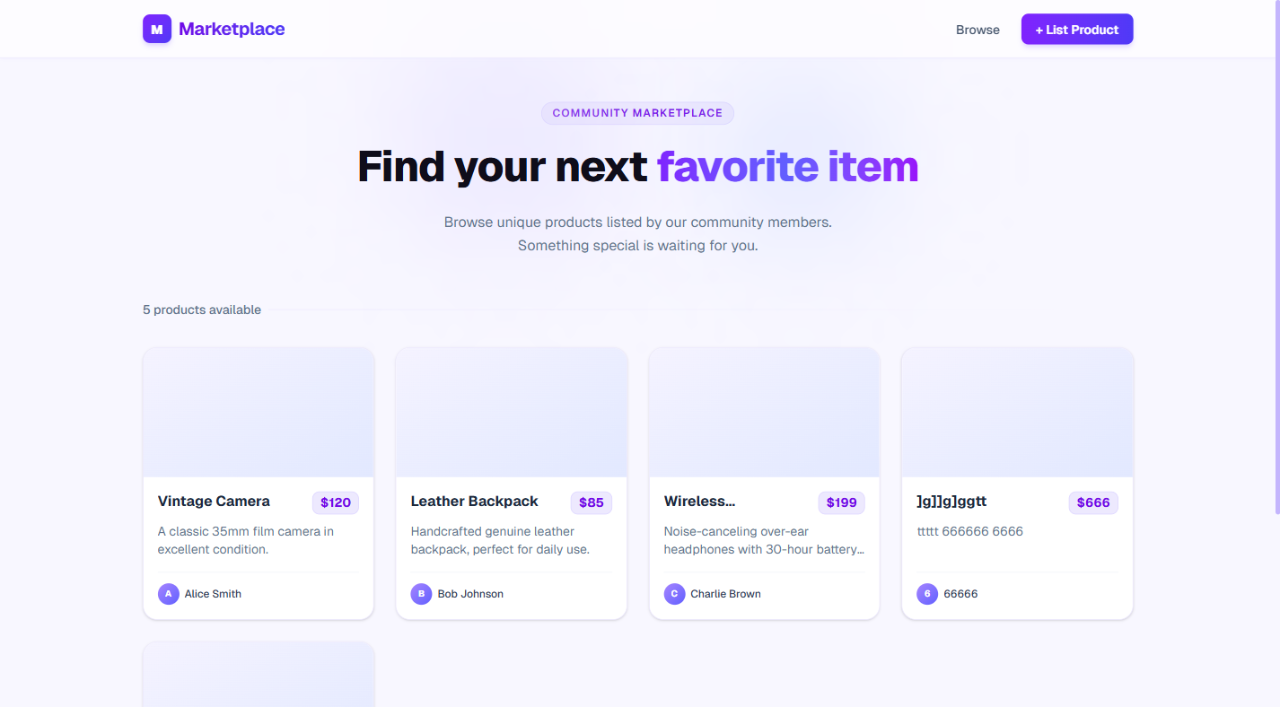
In this app, ProductCard is a Server Component that receives props from a parent component fetching data on the server. From source code alone, it is not immediately obvious which props survive the server-to-client boundary or how each card is represented in the live tree.
I used this prompt:
Open http://localhost:3000, then use next-browser to show me the React component tree and inspect the ProductCard component's props.
The agent returned the component hierarchy from the root AppRouter down to each rendered Server(ProductCard) instance:
Root > AppRouter > ... > Server(RootLayout)
 └── body
 ├── Server(Header)
 └── main > OuterLayoutRouter > ...
 └── Server(Home)
 └── div > div
 ├── Server(ProductCard) key="1"
 ├── Server(ProductCard) key="2"
 ├── Server(ProductCard) key="3"
 └── Server(ProductCard) key="1777815740158"
Targeting one ProductCard by node ID reveals the exact props it received at runtime:
{
 "product": {
 "id": "1",
 "name": "Vintage Camera",
 "description": "A classic 35mm film camera in excellent condition.",
 "price": 120,
 "seller": "Alice Smith"
 }
}
From that output, the agent can identify the component’s data contract:
ProductCard receives a single product propproduct object contains id, name, description, price, and sellerHomeThis is a good example of where runtime inspection beats source-only inference.
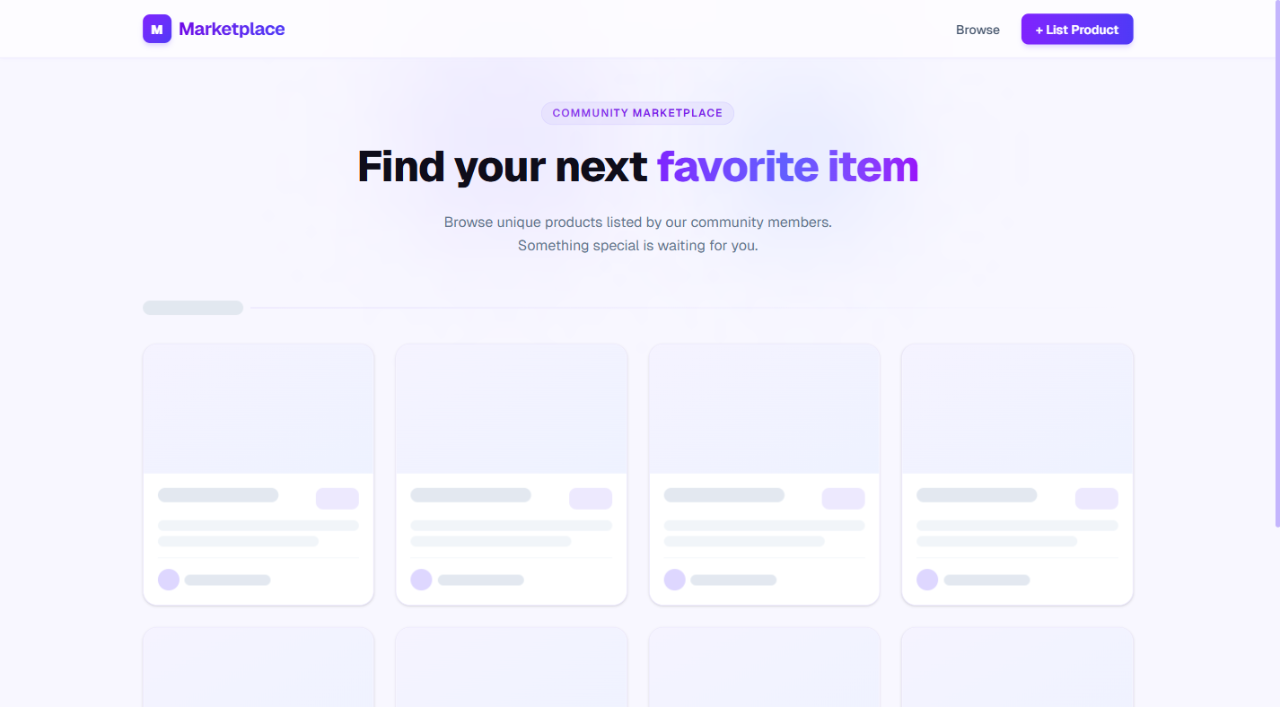
The homepage shows a skeleton while the product grid loads. Manually capturing that transient state for debugging or visual review can be annoying because it depends on network timing and Suspense behavior.
I used this prompt:
Open http://localhost:3000 using next-browser. Take a screenshot of the loading skeleton, then take another screenshot after the page has fully loaded.
The agent successfully isolated both states and confirmed that the Suspense boundary behaved as intended:
ProductListSkeleton handled the fallback UIThis is the loading skeleton during the initial fetch:
And this is the final UI after the data resolves:
SEO depends on what is available in the raw server-rendered HTML before hydration. If the most important content only appears after client JavaScript runs, crawlers and social preview bots may not see the page the way users do.
With next-browser, you can use SSR lock mode to inspect what the browser receives without external scripts:
Open http://localhost:3000 with next-browser. Lock SSR mode, take a screenshot showing the raw server-rendered HTML, then unlock SSR mode.
Under the hood, that maps to commands like:
next-browser ssr lock
next-browser reload
next-browser screenshot "SSR-only page output"
next-browser ssr unlock
This flow is useful because it avoids manually disabling JavaScript in the browser. In this test, the agent verified that the header, product cards, prices, and seller names were present in the initial HTML payload.
That confirms the product listing is crawlable at the HTML level. It does not replace a full technical SEO audit, but it gives agents a quick way to validate whether critical content is present before hydration.
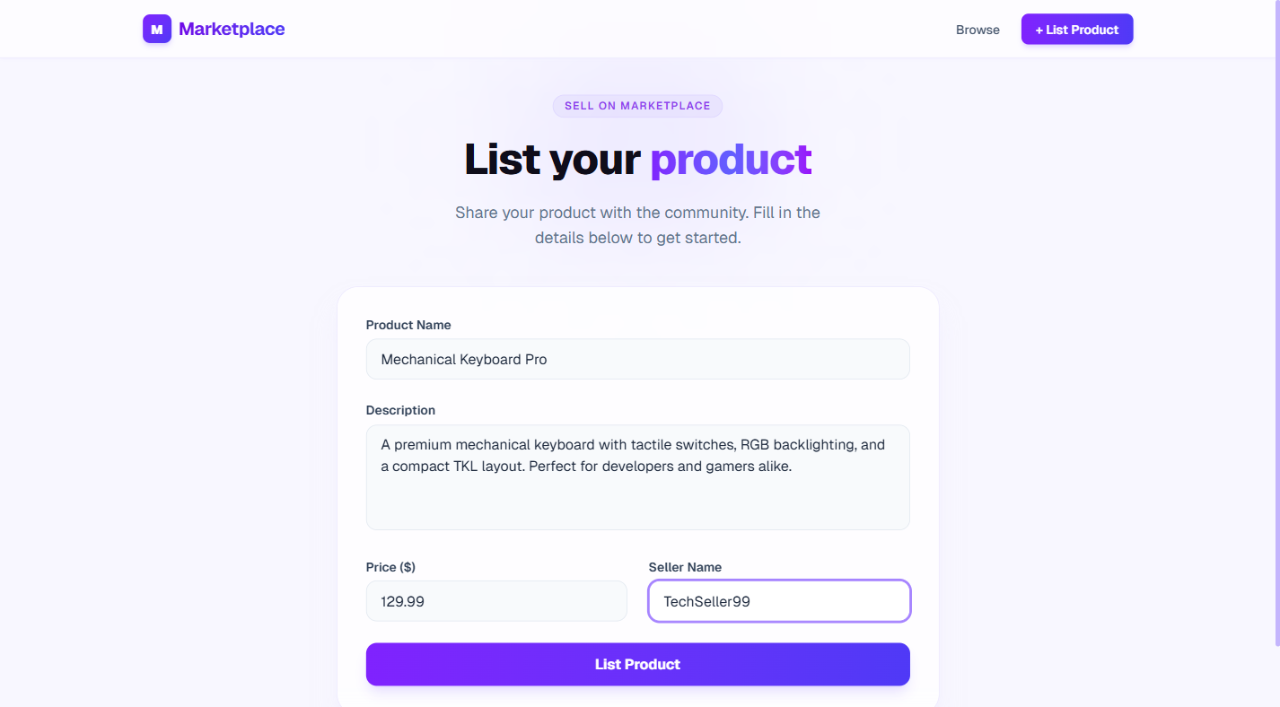
Next, I used next-browser to test the full add-product journey in one agent instruction: snapshot the list page, fill the form, submit it, and confirm the new product appears on the homepage.
Using next-browser, open http://localhost:3000/list, snapshot the page, fill in the form with a test product, take a screenshot, submit it, and take a final screenshot of the homepage showing the new product.
The flow covered four steps:
/list form structure and verify all fields are presentThis screenshot shows the form before submission:
After the Server Action completes and the redirect resolves, the new product appears in the grid and the count badge updates from 4 to 5:
This makes next-browser a useful complement to formal testing. It is not a replacement for Playwright, Cypress, or integration tests, but it gives coding agents a fast way to reproduce and inspect a flow before proposing a fix. For more on the form-submission side of this pattern, see LogRocket’s deep dive into Server Actions in Next.js.
After adding the product form, I wanted a quick performance baseline before shipping. Specifically, I wanted to inspect:
I used this prompt:
Use next-browser, open http://localhost:3000, and run a performance profile. Show me TTFB, LCP, CLS, and hydration timing.
The agent returned this high-level summary:
| Metric | Result | Interpretation |
|---|---|---|
| TTFB | 212.7ms | Slightly above a 200ms target, so server-side data fetching or middleware overhead may be worth inspecting. |
| LCP | No clear LCP candidate detected | The page may need a more prominent hero image or text element to make LCP easier to measure and optimize. |
| CLS | 0 | No layout instability was detected. |
| Hydration | 30ms | Healthy hydration timing; most overhead came from development-only components such as the hot reload overlay. |
This gives the agent an evidence-based starting point. Instead of saying “the app feels slow,” it can point to a specific metric, then inspect the server path, route structure, or component tree.
For related performance context, see LogRocket’s guide to Core Web Vitals best practices and its article on fixing slow Next.js apps.
Finally, I tested the product grid at mobile and desktop viewport sizes. The app uses CSS grid with breakpoint-specific column counts, so the question was whether the layout changed as expected and whether any controls were clipped on smaller screens.
I used this prompt:
Using next-browser, open http://localhost:3000. Take a screenshot at 375x812, then at 1440x900, and show me how the product grid changes.
The agent identified the expected layout differences:
This is the kind of bug agents often miss when they only inspect source code. The CSS may look reasonable, but the actual layout still needs to be checked in the browser.
next-browser is most useful when the agent needs runtime evidence before making a code change. Good use cases include:
It is less useful as a replacement for durable automated tests. If a workflow matters long term, promote it into Playwright, Cypress, or integration tests once the bug is understood. Use next-browser to help the agent investigate quickly; use tests to prevent the bug from coming back.
Each scenario in this guide exposed something static analysis alone could not show. Prop inspection revealed the exact data contract a Server Component received at runtime. SSR mode showed what a crawler could see before hydration. PPR commands exposed dynamic holes in the static shell. The performance profile surfaced a TTFB issue and confirmed zero layout instability. Responsive screenshots caught a mobile overflow bug without requiring manual browser inspection.
That is the real value of next-browser: it makes runtime frontend debugging repeatable and agent-readable. Instead of describing what the browser shows to an AI coding agent, you give the agent a command and get back structured output it can act on immediately.
For Next.js teams experimenting with agent-assisted development, that feedback loop matters. The agent stops guessing from source files alone and starts debugging against the application as it actually runs.
Build dynamic LLM routing in Next.js with OpenRouter, TanStack AI, task classification, model fallbacks, and cost-aware routing.
TSRX adds first-class control flow, conditional hooks, and scoped styles to React via a TypeScript compiler extension — no new framework required.
Learn how to build a full React Native auth system using Better Auth and Expo — with email/password login, Google OAuth, session persistence, and protected routes.
Compare the top AI development tools and models of June 2026. View updated rankings, feature breakdowns, and find the best fit for you.
Would you be interested in joining LogRocket's developer community?
Join LogRocket’s Content Advisory Board. You’ll help inform the type of content we create and get access to exclusive meetups, social accreditation, and swag.
Sign up now