 |
VOOZH | about |
|
VOOZH | about |
The Replay is a weekly newsletter for dev and engineering leaders.
Delivered once a week, it's your curated guide to the most important conversations around frontend dev, emerging AI tools, and the state of modern software.
Some knowledge of React is required to get the most out of this tutorial. Also, knowledge of performance optimization in React and component level memoization using React.memo is a plus.
There are several tools to measure performance optimization in React. But in this post, our focus is on the React profiler DevTool and the React Profiler API.
Before moving forward, it is important to note that performance is a tradeoff. Consequently, you can end up with a slower application after optimization.
It is important you use tools such as the React Profiler DevTool and the React Profiler API to measure the success/failure of the applied techniques.
In this section and the next, I will elaborate on performance optimization, using a specific technique called memoization. Then I’ll apply it to an example application and measure its effect using both the React profiler DevTool and the React Profiler API.
In computing, memoization is an optimization technique used primarily to speed up computer programs by storing the results of expensive function calls and returning the cached result when the same inputs occur again.
–Wikipedia
An application performs several, expensive, long-running computations throughout its lifecycle. The idea of memoization is to handle these computations in a pure function. All dependencies needed for these computations are passed as arguments, and when the function returns, its value is cached. Whenever the function is called with the same arguments, the cached value is returned. This means no unnecessary function calls, consequently, time-consuming long-running I/O can occur in an instant. The performance benefit of this is tremendous.
Although memoization is great, there is a downside to it. The size of our cache grows as we continue to store results for different dependencies. In a nutshell, we are trading space for speed.
I have given an overview of memoization, but how does this apply to React?
There are multiple ways to apply memoization in a React application. React gives us the useMemo and the useCallback Hook for this purpose. Libraries like Reselect use memoization under the hood and utility libraries like lodash have a _.memoize function.
In this tutorial, we will work with the React.memo. This function takes a React functional component as an argument. It memoizes its current rendered output and skips unnecessary re-renders, thus it will only rerender the component if its props change.
Before jumping into any of these, let’s call to mind our performance rule of thumb.
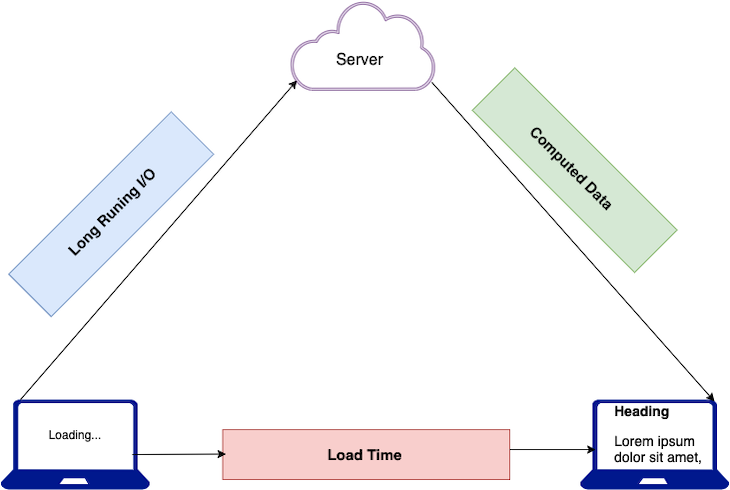
👁 load time from computed data and long running I/O
The diagram above shows how a React app renders its contents. We see that a loading component is displayed while the application performs a long-running computation. And when this finishes, the content is rendered to the user. We can also see that the load-time is the time taken to perform the long-running computation and render the appropriate content.
Long-running computations (I/O) are operations that require a lot of time and resources. It could be file upload, API calls (request for all the images in a gallery), a complex calculation, etc.
In performance optimization, the aim is to measure the load time of each component, identify the components that are causing performance problems, and fix them. I will be elaborating on these in the next section with a sample application.
To get the most out of the section, you should clone the repository and have your local setup by following these steps.
git clone https://github.com/lawrenceagles/profiler-demo
cd profiler-demo
yarn start or npm start
Kindly consider the code below:
import "./App.css";
import React, { useEffect, useState } from "react";
// component
import Languages from "./components/Languages";
function App () {
 let topLang = [ "JavaScript", "Python", "Rust", "TypeScript", "C++", "C" ]
 const [ languages, setLanaguages ] = useState([]);
 const [ count, setCount ] = useState(0);
 const dummyAPICall = () => setTimeout(() => setLanaguages(topLang), 5000)

 useEffect(() => {
 dummyAPICall();
 }, []);
 return (
 <div className='App'>
 <header className='App-header'>
 {languages.length === 0 && <h2>Welcome!</h2>}
 {languages.length ? (
 <Languages languages={languages} />
 ) : (
 <div className='text-warning text-center m-4'>
 Loading languages...
 </div>
 )}
 <hr />
 <h4>{count}</h4>
 <button
 className='mb-3 btn btn-primary'
 onClick={() => setCount((count) => count + 1)}
 >
 Add count
 </button>
 </header>
 </div>
 );
}

export default App;
The code above is just a small portion of the app. It simulates a long-running computation by calling the dummyAPICall function when the component mounts. When this finishes, the language state is updated, and its value is passed as props to the language component. Both of these triggers a re-render as expected. And a list of the languages is displayed.
Also, we have a button that is used to simulate user interactivity with our app. When clicked, it updates the count state and expectedly, this triggers a render update. Since this event does not affect the language state or component, the language component should not be re-rendered, right? Well, it gets re-rendered and that is the problem.
From the implementation below:
import React from "react";
import PropTypes from "prop-types";
const Languages = ({ languages }) => {
 return (
 <div>
 <h3>Top 6 Languages:</h3>
 {(console.log("I am mounting!"),
 languages.map((language, index) => <p key={index}> {language} </p>))
 }
 </div>
 );
};
Languages.propTypes = {
 languages : PropTypes.array.isRequired,
};
export default Languages;
Here, we see that the language component receives a languages prop (an array), maps through it, and renders each array item. I have added a console.log() statement. This is to allow us to track how many times this component gets re-rendered. It is not the most adept tool, but it is quite handy.
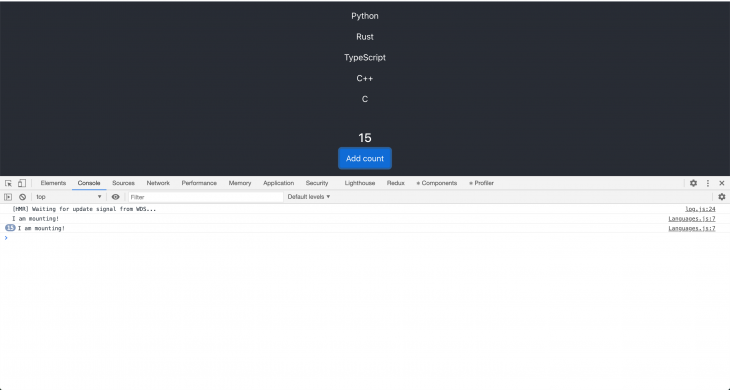
Consider the image below:
👁 Message in console indicating component was mounted 15 times
We can see that the language component gets re-rendered as many times as the button was clicked (15 times in this case). Remember, the button is used to simulate real-life UI components like date picker, comment box, etc. This means our language component will be re-rendered when a user selects a date, makes a comment, or interacts with our UI.
Operations like these are expensive in a real-world scenario, so we must collect timing information, to measure the cost of each render. To do this, we will employ the React Profiler DevTool.
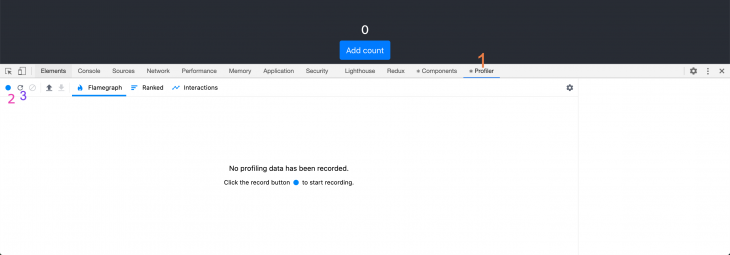
The profiler DevTool plugin was introduced in React 16.5. It uses the React profiler API under the hood to collect timing information of each rendered component. This makes it a nifty tool for identifying performance bottlenecks in React applications. To profile your component using the profiler DevTool follow these steps:
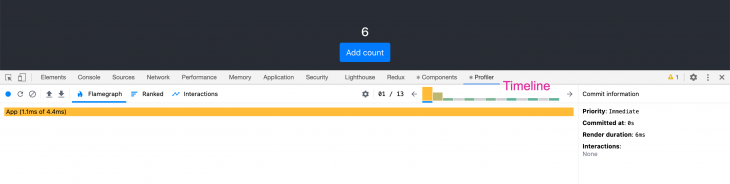
Notice the timeline section that displays an array of bars with the first two being the tallest, followed by six green colored ones with the same height.
The first represents the mount phase of the App component, so it took the most time to render. We can see the render duration was 6ms. Mounting is more expensive than subsequent re-renders because it is a DOM required change. Subsequent re-renders only change some values in the DOM and do not create a new DOM node.
👁 counter with process shown in console
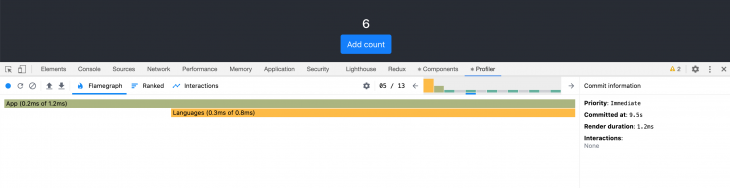
The six green bars represent the six re-renders resulting from the click event. Clicking each bar shows the render duration and more commit information.
Although most of the renders for our app occurs in milliseconds, it is not so in a real-world situation. The render duration can easily become very high, and this can drastically affect our app’s performance. The entire purpose of this example is to show you how to collect performance information to identify performance bottlenecks. Also, more performance information can be found at Flamegraph and ranked chat.
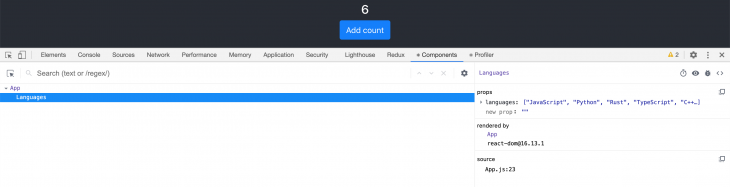
One very important piece of information we need is to know the state of the props during each render. For this, you can click on any of the bars in the timeline and click on the components tab. This gives you the components props during that render.
From the image above, we can see that the languages component prop did not change during each re-render. This makes each re-render unnecessary and a lot more costly, consequently, this is an area where we need to improve our app.
Since we have been able to identify the need for optimization in our app, and we have a way to measure our input, we can proceed to optimize our app.
Remember that in memoization, if the input (in this case, the props) does not change, a cached value is returned, thus improving performance. For this, we can use React.memo to memoize the languages component so that it does not re-render if the props do not change.
So the Languages component can be re-implemented like this:
import React, {memo} from "react";
import PropTypes from "prop-types";
const Languages = ({ languages }) => {
 return (
 <div>
 <h3>Top 6 Languages:</h3>
 {(console.log("I am mounting!"),
 languages.map((language, index) => <p key={index}> {language} </p>))
 }
 </div>
 );
};
Languages.propTypes = {
 languages : PropTypes.array.isRequired,
};
export default memo(Languages);
Right now, we are exporting the memoized languages component, and this would only be re-rendered if the props are passed to it.
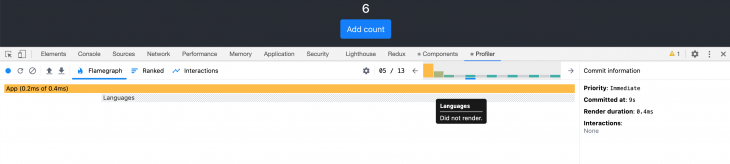
We can now start profiling our components again to measure our efficiency. Consider the image below.
👁 languages did not render message
From the image above, we see that during each render phase from the timeline, the languages component did not render. Thus once the languages component mounts it only gets re-rendered when its props change. This eliminates the cost of unnecessary rendering, consequently improving our app’s performance.
If you don’t want to deal with the React DevTool you can use the React profiler API directly.
The Profiler API is a component that enables us to collect performance information to measure the cost of rendering:
import "./App.css";
import React, { useEffect, useState, Profiler } from "react";
// component
import Languages from "./components/Languages";
function App () {
 let topLang = [ "JavaScript", "Python", "Rust", "TypeScript", "C++", "C" ]
 const [ languages, setLanaguages ] = useState([]);
 const [ count, setCount ] = useState(0);
 const dummyAPICall = () => setTimeout(() => setLanaguages(topLang), 5000)

 useEffect(() => {
 dummyAPICall();
 }, []);
 return (
 <div className='App'>
 <header className='App-header'>
 {languages.length === 0 && <h2>Welcome!</h2>}
 {languages.length ? (
 <Profiler
 id="language"
 onRender={
 (id, phase, actualDuration) => {
 console.log({id, phase, actualDuration})
 }
 }>
 <Languages languages={languages} />
 </Profiler>
 ) : (
 <div className='text-warning text-center m-4'>
 Loading languages...
 </div>
 )}
 <hr />
 <h4>{count}</h4>
 <button
 className='mb-3 btn btn-primary'
 onClick={() => setCount((count) => count + 1)}
 >
 Add count
 </button>
 </header>
 </div>
 );
}

export default App;
Above we have implemented the Profiler API by simply importing it and wrapping our language component with it. It takes two props and they are:
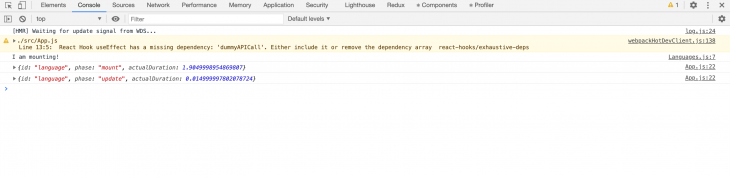
onRender callback. This callback takes a number of arguments but the first three (id, phase, and actualDuration) are requiredIn this onRender function, we log and object with these three arguments to the console. And this gives us all the performance information we need as seen in the image below:
The React Profiler component and the React Profiler DevTool are both amazing and can be used together. You can get more details on the React Profiler API here.
It is not recommended to use the React Profiler API in production. However, if you need it badly, you can get instructions on how to use it in production here. I hope that this post will change your approach to performance optimization for the better.
Install LogRocket via npm or script tag. LogRocket.init() must be called client-side, not
server-side
$ npm i --save logrocket

// Code:

import LogRocket from 'logrocket';
LogRocket.init('app/id');
// Add to your HTML:

<script src="https://cdn.lr-ingest.com/LogRocket.min.js"></script>
<script>window.LogRocket && window.LogRocket.init('app/id');</script>
TSRX adds first-class control flow, conditional hooks, and scoped styles to React via a TypeScript compiler extension — no new framework required.
Learn how to build a full React Native auth system using Better Auth and Expo — with email/password login, Google OAuth, session persistence, and protected routes.
Compare the top AI development tools and models of June 2026. View updated rankings, feature breakdowns, and find the best fit for you.
Learn how Bloom filters reduce database lookups for username availability checks while preserving correctness at scale.
Hey there, want to help make our blog better?
Join LogRocket’s Content Advisory Board. You’ll help inform the type of content we create and get access to exclusive meetups, social accreditation, and swag.
Sign up now