 |
VOOZH | about |
|
VOOZH | about |
Editor’s note: This post was updated by Timonwa Akintokun on 14 May 2024 to cover advanced techniques for working with app bundles, such as manually tweaking webpack configurations for finer bundling control, adding information about how to open and inspecting bundle files, and exploring custom webpack configurations for optimizing bundling.
👁 How To Analyze Your Next.js App BundlesOne crucial aspect of any web application is the size and performance of its codebase. Next.js is a popular JavaScript framework for building server-rendered and statically-exported React applications.
Next.js provides the ability to automatically optimize an application’s code and minimize its bundle size. This can reduce the amount of data that needs to be transferred to the client, thereby improving performance. However, regularly analyzing your Next.js app’s bundle can help ensure that it is as optimized as possible and can also help identify potential areas for improvement.
In this article, we’ll discuss what a Next.js app bundle is and how bundle analyzer tools work. We’ll demonstrate how to use the @next/bundle analyzer package to inspect your Next.js app bundles and talk about a few alternatives. Lastly, we’ll discuss how to use bundle analysis to improve Next.js app performance.
The Replay is a weekly newsletter for dev and engineering leaders.
Delivered once a week, it's your curated guide to the most important conversations around frontend dev, emerging AI tools, and the state of modern software.
When you build a Next.js app, the code gets organized into small units called modules. These modules are bundled together by webpack, a popular JavaScript module bundler, to form a single file called a bundle. This bundle is then served to the client’s browser, which is executed to render the application.
As web applications become more complex and feature-rich, the size of their codebase can grow significantly. This can lead to slower loading times, which can frustrate users and negatively impact your app’s performance.
Additionally, larger codebases are often more challenging to maintain, making it harder to identify and fix bugs. By analyzing your app bundles, you can identify areas where you can optimize your code to reduce its size and improve its performance.
Several bundlers exist, but this article will focus on using one of the most popular bundling tools, the webpack-based @next/bundle-analyzer package.
The @next/bundle-analyzer package is a plugin for the Next.js framework that allows you to analyze the size and composition of your app’s bundle. By identifying large or unnecessary code blocks, you can reduce overall bundle size, which can help optimize the performance of your Next.js app.
The bundle-analyzer plugin generates a visual report that provides information about the size and contents of your app bundle, making it easier to identify areas for optimization. @next/bundle-analyzer generates a static HTML file that contains a detailed report on your app’s codebase, including information on the size of each component and its dependencies.
To use the @next/bundle-analyzer package, you must install it into an existing Next.js project. For this tutorial, I’ll use my open source project, Tech Career Roadmap, as the Next.js example project.
To start, install the package with either npm or Yarn:
# npm
npm install --save-dev @next/bundle-analyzer cross-env
# Yarn
yarn add -D @next/bundle-analyzer cross-env
You’ll notice that I also installed cross-env; we’ll use this package later in this article to set an environment variable. The cross-env package will allow us to set environment variables when running scripts in our package.json file without any errors, regardless of our platform-specific syntax or our OS.
After you’ve installed the packages, you can enable the bundle analyzer by adding the following code to your next.config.js file:
const withBundleAnalyzer = require('@next/bundle-analyzer')({
 enabled: process.env.ANALYZE === 'true',
})
module.exports = withBundleAnalyzer({
 // your Next.js configuration
})
To run an analysis for your app bundles, you’ll need to start your Next.js app in development mode with the ANALYZE environment variable set to true. Then, run the following command to view the analysis:
ANALYZE=true npm run build
This command will automatically:
analyze folder in your .next folder inside your root directory and create three files: client.html, nodejs.html, and edge.htmlclient.html file represents the client side, and the nodejs.html file represents the server side. At the time of writing, there is no data supplied for the Edge.html page. It will presumably represent edge APIs, but we have been unable to get confirmation from the package’s maintainersAfter the bundle analyzer has run, you can start inspecting your bundles:
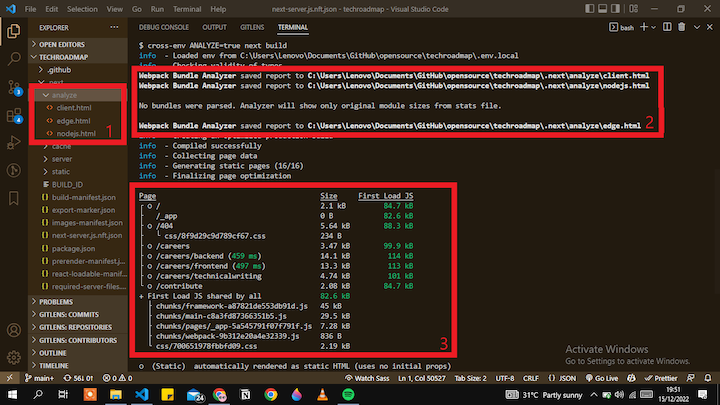
👁 Next.js Bundle Analyzer Example Terminal
The @next/bundle-analyzer package provides a few ways to inspect your bundles: via the terminal, via the browser, and by using the sidebar filter. Let’s take a look at these different methods.
In the above image showing the terminal output, there’s a table displaying Page, Size, and First Load JS. Under the Page header is a list of all the pages in your Next.js app and chunks from the First Load JS bundle.
The First Load JS bundle is all the code shared or used by the app pages at the initial load. Under the Size header, the package displays the file size of each page, bundle, and the chunks that make up the bundle.
Under the First Load JS, you can see the final size of the page or after the First Load JS has been added. The First Load JS size is also the size of the pages upon initial load.
Next.js also color codes these sizes. Green tells us that the size is small and OK, while red indicates that the size is too large. If your First Load JS bundle size is shown in red, try to reduce it until it is displayed in green because the size of the bundle also affects the size and state of all your pages.
To inspect your app bundles in your browser, simply go to your browser to see two pages opened for you by the analyzer.
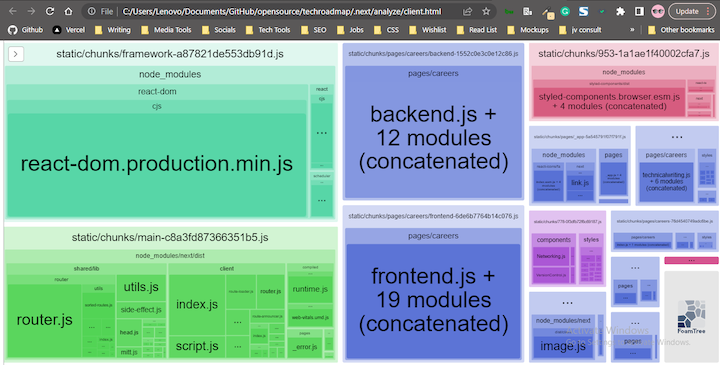
The first page, client.html, displays all the bundles for the client side:
👁 Next.js App Bundles Client Side
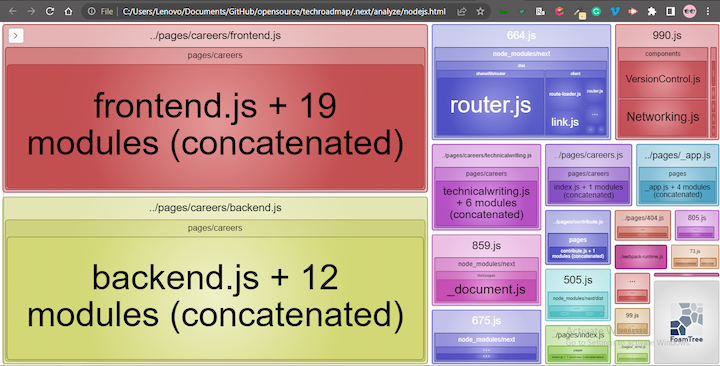
The second page, nodejs.html, displays all the bundles for the server side:
👁 Next.js App Bundles Server Side
If your app’s pages are not automatically loaded, or if you have already closed the browser, just go into the analyze folder and right-click on any file names in order to open them in your browser.
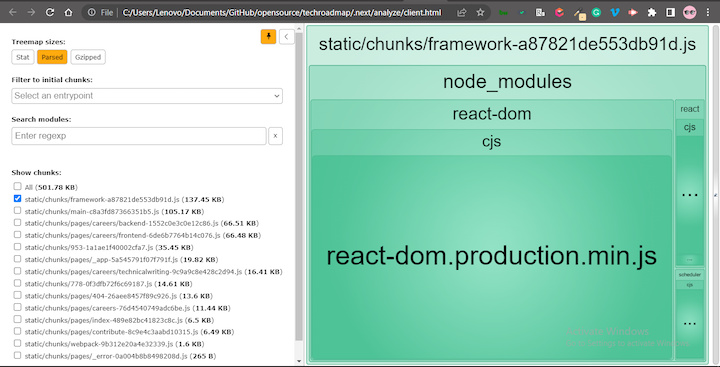
Next, simply hover over any of the bundles to see its stats. You’ll be able to see the stat size, parsed size, and gzipped size of each bundle, as well as the bundles’ file path.
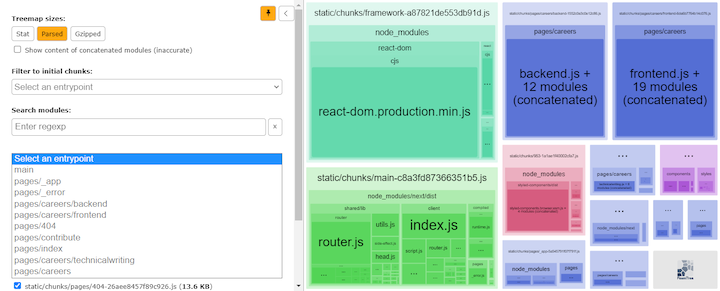
With the analyzer pages in the browser, you’ll be able to see which bundles are taking up the most space based on their size type. Also, the bundles are arranged based on their file sizes:
👁 Next.js Bundle Analyzer Example
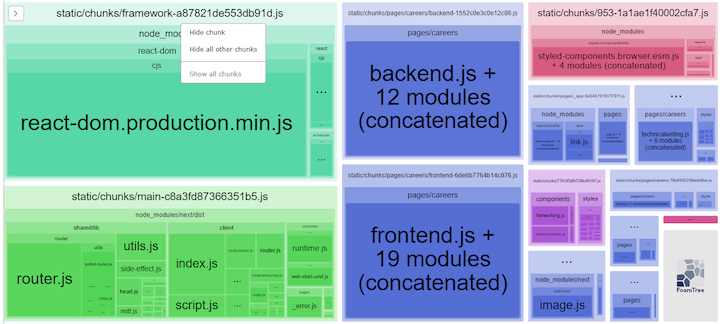
You can also right-click on the root bundle to view options related to that chunk. You can click Hide chunks to hide that particular chunk from view and view the rest, click Hide all other chunks to hide all other chunks except the one you clicked on or click Show all chunks to show all the chunks that are currently hidden:
👁 Viewing Next.js Bundle Analyzer Hide Chunk Option
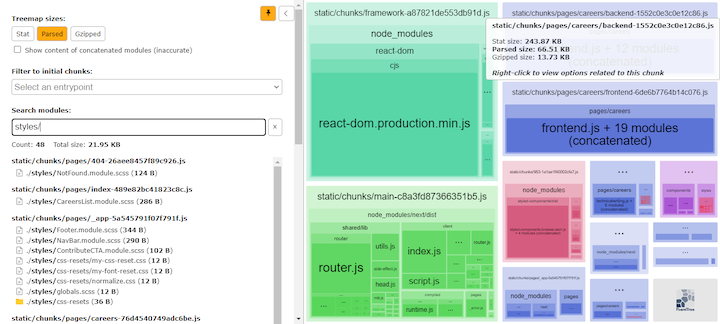
Another way to interact with and inspect your bundles is to use the sidebar filter. In the sidebar, you can specify a particular bundle or set of bundles that you’d like to view.
This approach can be useful for visualizing and inspecting smaller bundles quickly. You can also opt to have them ordered based on the size type: Stat, Parsed, or Gzipped:
👁 Viewing Next.js Bundle Analyzer Sidebar
You can search for modules using a particular file, folder, or phrase from your app; the analyzer will display results based on your search input:
👁 Searching Next.js Analyzer Modules File Folder Phrase
Or, you can select an entry point for initial chunks (i.e., any of your app’s pages):
👁 Filter Next.js Bundle Analyzer Initial Chunks
To save time, you can also create a quick command/script to run in your package.json file. By doing so, you can avoid setting the environment variable on every call.
In your package.json file, add the following script:
"scripts": {
 …
 "analyze": "cross-env ANALYZE=true next build"
},
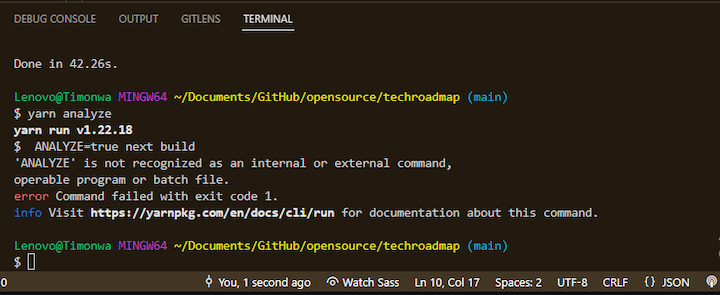
As I mentioned previously, cross-env allows us to set environment variables in our package.json file. In this case, we are setting ANALYZE to true. If you were using a Windows operating system and didn’t install cross-env, you’d get an error like the one shown below when running the above script:
👁 Error Did Not Install Cross-Env
Now, let’s test our code by running one of the following commands:
# npm
npm run analyze
# Yarn
yarn analyze
Running either of the above command results in the same action as running the following:
ANALYZE=true npm run build
Apart from using bundle analysis tools, there are some advanced techniques that you can use to optimize your Next.js app bundles. Let’s look at a few examples.
Earlier in the article, we modified our Next.js config by adding @next/bundle-analyzer to our next.config.js file, which helped us to analyze our app bundles. We can also use it to modify our webpack settings by adding loaders, plugins, or other optimization configurations to the webpack. But before adding them, you must ensure that Next.js is not already handling such optimizations for you.
To customize the webpack configuration, just add the webpack property to your next.config.js file and pass your configurations on to it:
module.exports = {
 webpack: (config, { isServer }) => {
 if (!isServer) {
 config. optimization.splitChunks.cacheGroups = {
 vendor: {
 test: /[\\/]node_modules[\\/]/,
 name: 'vendors',
 chunks: 'all',
 },
 }
 }
 return config
 },
}
In the code snippet above, we are modifying our webpack configuration by splitting the vendor libraries into a separate chunk for the client-side bundle. This example shows you how you can customize the webpack to handle bundle sizes.
Code splitting is when you split your code into small chunks, which can then be loaded when needed. It is a very useful technique, especially in large applications, as it reduces the initial page load of your pages.
Next.js already does this for you, allowing only the necessary code needed to render the page to be loaded. However, you can also manually optimize your pages by using dynamic imports. Here is an example:
import dynamic from 'next/dynamic';
const DynamicComponent = dynamic(() => import('../components/DynamicComponent'), {
 loading: () => <p>Loading...</p>,
});
export default function Page() {
 return <DynamicComponent />;
}
Here, the DynamicComponent will only be loaded when needed, so it doesn’t increase your page’s load time.
You can also reduce the size of your app bundles by replacing heavy libraries with lighter ones. For example, if you were using moment.js to handle dates in your application, you might want to consider switching it to date-fns or day.js, which are smaller in size compared to moment.js.
Similarly, if you are using a library where you only need a single component but end up importing the entire library, it would be best just to import the particular module you need. For instance, instead of importing the whole lodash library, you can import only the necessary functions:
// Instead of this:
import _ from 'lodash';
// Do this:
import debounce from 'lodash/debounce';
This ensures that only the required library parts are included in your bundle, significantly reducing its size.
debugger to find issues in Next.js bundlesYou can use the debugger statement to find issues in your bundle. Adding the debugger statement to your code allows you to debug your client-side code. When you start the server with npm run dev or yarn dev and the statement is called, the browser pauses code execution, allowing you to inspect the code up to that point in the browser’s DevTools.
To debug on the server side, you need to include the --inspect flag in your development script. You can do so by updating your package.json like so:
{
 "scripts": {
 "dev": "NODE_OPTIONS='--inspect' next dev"
 }
}
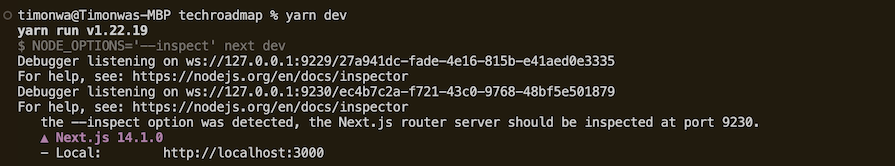
Then, start your development server again with npm run dev or yarn dev. It will show you something similar to this in your terminal:
👁 Our Terminal When Using The Debugger Statement
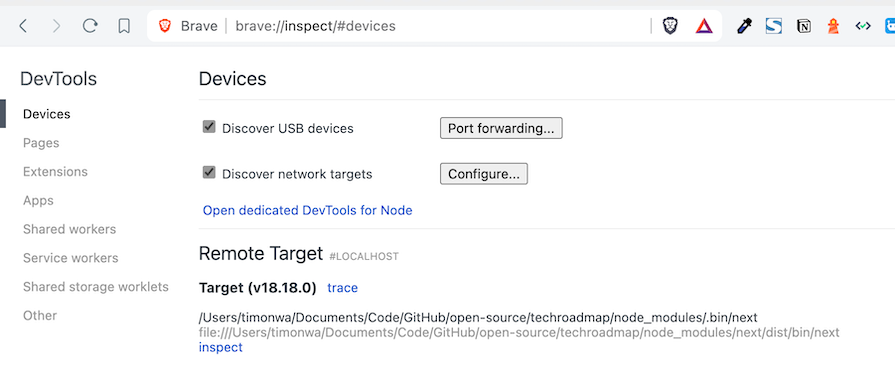
Next, open chrome://inspect in Chrome. You will see your Next.js application inside the Remote Target section. Click on Inspect to open it in a separate Chrome DevTools window:
👁 Details For The Chrome Inspect Page
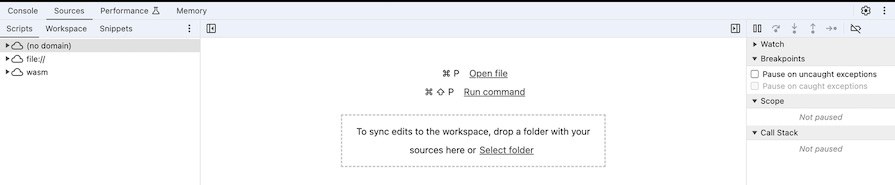
Then, click on the Sources tab and inspect your app as you would on the client side:
You can use the Sources panel to set breakpoints, inspect variables, and step through your server-side code. This helps you identify and resolve issues within your bundle.
Bundle analysis is an essential tool for optimizing app performance. It helps identify potential bottlenecks and areas for improving an app’s load speed and reducing its bundle size. Let’s explore some tips you can use to identify issues using the bundle analysis report:
next.config.js for exampleConsider this scenario where a Next.js app that was analyzed with the @next/bundle-analyzer tool and the following issues were identified:
To optimize the app’s performance, here are some possible ways to address the above issues:
While @next/bundle-analyzer is a popular choice for analyzing the bundle size of a Next.js app, several other options are available. Here are some alternatives to consider:
These are just a few of the many options available for analyzing the bundle size of a Next.js app. Consider experimenting with different tools to find the one that best fits your needs.
In this article, we discussed what a Next.js bundle is and investigated how bundle size can impact website performance. We also demonstrated how to use the @next/bundle-analyzer package to analyze and inspect the bundles in various ways, such as in the terminal, the browser, and the tool’s sidebar filter.
Additionally, we covered some advanced techniques for working with app bundles, like customizing webpack configurations, implementing code splitting, and replacing heavy libraries with lighter alternatives, along with some tips and tricks you can implement when inspecting your bundle analysis for issues and improving performance.
Through this analysis, you’ll identify potential bottlenecks, such as duplicated or unused npm packages and large image sizes. You’ll be able to optimize your app’s performance by reducing bundle size and improving load speed. Bundle analysis is a critical tool for any developer looking to optimize their Next.js application and enhance user experience.
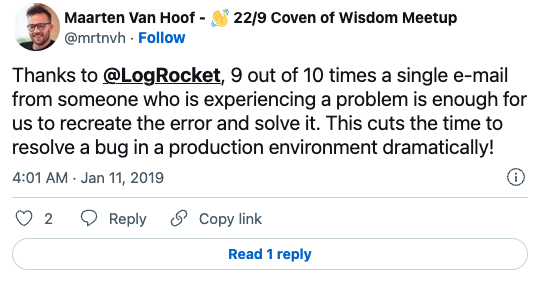
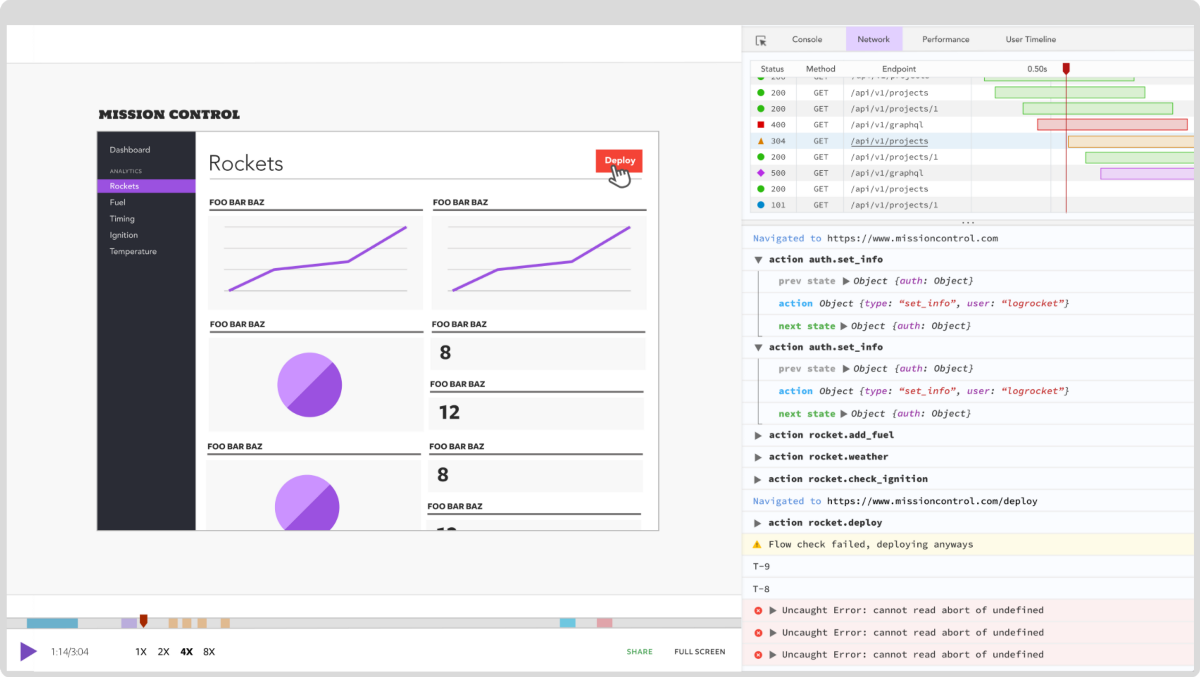
Debugging Next applications can be difficult, especially when users experience issues that are difficult to reproduce. If you’re interested in monitoring and tracking state, automatically surfacing JavaScript errors, and tracking slow network requests and component load time, try LogRocket.
LogRocket captures console logs, errors, network requests, and pixel-perfect DOM recordings from user sessions and lets you replay them as users saw it, eliminating guesswork around why bugs happen — compatible with all frameworks.
LogRocket's Galileo AI watches sessions for you, instantly identifying and explaining user struggles with automated monitoring of your entire product experience.
The LogRocket Redux middleware package adds an extra layer of visibility into your user sessions. LogRocket logs all actions and state from your Redux stores.
👁 ImageModernize how you debug your Next.js apps — start monitoring for free.
TSRX adds first-class control flow, conditional hooks, and scoped styles to React via a TypeScript compiler extension — no new framework required.
Learn how to build a full React Native auth system using Better Auth and Expo — with email/password login, Google OAuth, session persistence, and protected routes.
Compare the top AI development tools and models of June 2026. View updated rankings, feature breakdowns, and find the best fit for you.
Learn how Bloom filters reduce database lookups for username availability checks while preserving correctness at scale.
Would you be interested in joining LogRocket's developer community?
Join LogRocket’s Content Advisory Board. You’ll help inform the type of content we create and get access to exclusive meetups, social accreditation, and swag.
Sign up now