 |
VOOZH | about |
|
VOOZH | about |
Memory leaks are one of those problems every software application eventually runs into, and React apps are no exception.
👁 ImageIf you’ve ever used a React application that starts out fast but slowly becomes sluggish, you’ve probably seen the symptoms. Maybe the UI begins to stutter. Maybe interactions start feeling delayed. In the worst cases, the browser tab can even freeze or crash entirely.
React does handle a lot of performance optimizations internally, but it can’t manage everything for you. Developers are still responsible for cleaning up the side effects their components create, things like event listeners, timers, subscriptions, or asynchronous operations.
In this article, we’ll explore what memory leaks look like in React applications, how to recognize when they’re happening, and some of the most common patterns that cause them in the first place.
The Replay is a weekly newsletter for dev and engineering leaders.
Delivered once a week, it's your curated guide to the most important conversations around frontend dev, emerging AI tools, and the state of modern software.
In the broader programming context, memory leaks happen when an application allocates memory but fails to release it back to the system.
JavaScript tries to mitigate this problem with something called garbage collection. Instead of requiring developers to manually allocate and free memory, the JavaScript engine periodically scans through memory and removes anything that is no longer reachable by the application.
However, garbage collection only works when objects are truly unreachable. If anything in your application still holds a reference to an object, the engine assumes it might still be needed and leaves it alone. This is where memory leaks creep into React applications.
When a React component mounts, it often sets up side effects, things like:
These effects live outside React’s normal rendering lifecycle, so if they are not explicitly cleaned up, they can continue to run in the background and retain references to state values, props, or even DOM nodes that no longer exist in the UI.
Over time, these lingering effects can pile up, causing memory usage to slowly grow.
Learning to recognize when these leaks happen is an important first step toward preventing them.
Memory leaks rarely show up as obvious bugs. Your application won’t usually crash the moment one appears. Instead, they gradually degrade performance over time.
Since the browser doesn’t immediately run out of memory, everything continues working for a while. But as that unused memory accumulates, the application gradually becomes less responsive.
This slow buildup is exactly what makes memory leaks so difficult to detect.
Because of this, developers typically rely on a mix of signals to identify when a leak might be happening. That can include user-facing issues like slowdowns during long sessions, warnings in the development environment, and diagnostic tools that reveal how memory usage changes over time.
One of the earliest signs of a memory leak is progressively worsening performance in applications that users keep open for long periods.
The application may feel perfectly responsive at first, but as the user continues interacting with it, performance gradually declines, and you begin to notice:
Before React 18, React would sometimes show a warning when an asynchronous operation tried to update state after its component had already been removed from the UI.
A common example is a fetch request. Imagine a component starts a request, but before the response comes back, the user navigates away, and the component unmounts. When the request finally resolves, it still tries to call setState.
At that point, React raises a warning.
Now, it’s important to understand something here: this warning doesn’t automatically mean your app has a memory leak.
In many cases, React simply treats the state update as a no-op (no operation) and ignores it. Since the component no longer exists, React just drops the update and moves on.
So why show the warning at all?
The reason is that React can’t actually see what’s happening inside your useEffect. It doesn’t know whether the asynchronous operation might still be holding onto references or continuing to do work in the background.
Because there’s still a possibility that something wasn’t cleaned up properly, React shows the warning as a signal that you might want to double-check what’s happening.
Another helpful way to track down memory leaks is by using browser tools and extensions.
One of the most useful tools for React developers is the React Developer Tools extension. It allows you to inspect your application’s component tree directly inside the browser.
With it, you can see how components are structured, how their props and state change over time, and when they re-render. This visibility can make it much easier to spot components that are behaving in unexpected ways.
Now that we understand why memory leaks happen in React applications, let’s take a closer look at how they actually occur.
Seeing these patterns in practice makes it much easier to recognize when something similar might be happening in your own code.
Below are some of the most common causes of memory leaks in React apps, along with ways to fix them.
Asynchronous operations can sometimes lead to memory leaks if they finish after the component that started them has already unmounted. But there’s a common misconception about how this actually happens.
Many developers assume the leak occurs when an async operation completes and tries to update state on an unmounted component. In reality, React simply ignores that update. Since the component no longer exists, React treats it as a no-op.
The real problem happens when an async operation creates long-lived references.
Promises, for example, don’t stick around forever. A promise from something like fetch either resolves or rejects once. It runs, finishes, and then it’s done. By itself, it doesn’t keep running in the background.
Take this example:
useEffect(() => {
 fetch("/api/user")
 .then(res => res.json())
 .then(data => setUser(data))
}, [])
If the component unmounts before the request finishes, the async operations lifecycle will be as follows:
At that point, the operation is finished. The closure is released, and the JavaScript garbage collector can free the memory. Nothing is left holding onto it.
So, where do async-related memory leaks actually come from?
They typically happen when the async logic involves subscriptions that continue running, things like timers, sockets, data streams, or event listeners that aren’t cleaned up.
To be clear, even though fetch itself isn’t the source of the leak, the code around it can still lead to memory issues or wasted resources.
For example, imagine a useEffect with a dependency that changes rapidly.
useEffect(() => {
 fetch(`/api/data?id=${id}`)
 .then(r => r.json())
 .then(setData)
}, [id])
Each id change triggers a new fetch request, creating multiple pending promises. Until those promises resolve, their closures stay alive in memory.
A similar situation can happen when large data structures are captured inside a closure.
const bigData = new Array(1000000)

fetch("/api")
 .then(() => {
 console.log(bigData)
 })
In cases like this, the closure holds onto something like big data until the promise resolves. If that data is large, it can temporarily increase memory usage.
These situations aren’t traditional memory leaks, but they retain resources longer than necessary, which can still cause performance problems over time.
Event listeners are one of the easiest ways to accidentally introduce memory leaks into your application. When a component attaches a listener to global objects like window, document, or other DOM elements, that listener can continue to reference the component even after it unmounts, unless it’s explicitly removed.
To see how this happens, imagine a component that listens for window resize events:
 useEffect(() => {
 console.log(`Component ${idRef.current} mounted. Adding resize listener.`);

 const handleResize = () => {
 console.log(
 `Resize listener fired from component ${idRef.current}. Count:`,
 count,
 );
 };

 window.addEventListener("resize", handleResize);

 }, [count]);
In this example, the event listener is never removed. If the component unmounts and later mounts again, another listener will be added.
Notice how multiple resize logs are firing. Each one is from an old listener that was never removed, and each listener still holds a reference to the old component state. This is exactly how event listeners can cause memory leaks.
To fix this, you simply clean the listener when the component unmounts:
 useEffect(() => {
 ...

 // Cleanup function to remove the listener on unmount
 return () => {
 window.removeEventListener("resize", handleResize);
 };
 }, [count]);
Here, the useEffect cleanup function removes the resize event listener, allowing the garbage collector to reclaim memory associated with handleResize once the component unmounts.
Timers and intervals like setTimeout and setInterval can also cause memory issues if they keep running after a component has unmounted.
If the timer’s callback references the component’s state or props, those values stay in memory until the timer finishes or is cleared.
For example:
const TimerComponent = () => {
 const [count, setCount] = useState(0);

 useEffect(() => {
 const intervalCount = setInterval(() => {
 setCount((prevCount) => prevCount + 1);
 }, 1000);

 }, []);

 return <div>Count: {count}</div>;
};
This interval will run indefinitely, even if TimerComponent unmounts.
To prevent this, always clear timers during cleanup:
const TimerComponent = () => {
 const [count, setCount] = useState(0);

 useEffect(() => {
 const intervalId = setInterval(() => {
 setCount((prevCount) => prevCount + 1);
 }, 1000);

 // Cleanup function to clear the interval on unmount
 return () => {
 clearInterval(intervalId);
 };
 }, []);

 return <div>Count: {count}</div>;
};
Many applications rely on subscriptions to external data sources, such as WebSockets, Firebase listeners, or event emitters. These subscriptions often register callbacks that remain active until explicitly unsubscribed.
import { useEffect, useState } from "react";
import { messageService } from "./messageService";

export default function Chat() {
 const [messages, setMessages] = useState([]);

 useEffect(() => {
 messageService.subscribe((msg) => {
 setMessages((prev) => [...prev, msg]);
 });
 }, []);

 return (
 <div>
 …
 </div>
 );
}
In this example, the component subscribes to the message service but never unsubscribes.
When the component unmounts, the subscription stays active and still references setMessages, which keeps that state in memory.
If the user later navigates back to the component, a second subscription is created. Over time, these subscriptions stack up and keep running.
Most external subscriptions provide a cleanup or unsubscribe method that you can call when your components unmount to prevent memory leaks.
export default function Chat() {
 const [messages, setMessages] = useState([]);

 useEffect(() => {
 const unsubscribe = messageService.subscribe((msg) => {
 setMessages((prev) => [...prev, msg]);
 });

 return () => {
 unsubscribe();
 };
 }, []);
 …
 }
This also applies to websocket subscriptions such as the following:
useEffect(() => {
 const socket = new WebSocket("wss://example.com");

 socket.onmessage = (event) => {
 console.log(event.data);
 };

 return () => {
 socket.close();
 };
}, []);
The key takeaway is to always clean up whenever a component subscribes to something external and always confirm that the external subscriptions you’re subscribing to provides a cleanup method.
Sometimes memory issues arise when callbacks capture outdated state through closures. These stale references can keep older data in memory longer than necessary.
For example:
setInterval(() => {
 setCount(count + 1)
}, 1000)
Here, count is captured in the closure and it may reference outdated values. A safer approach would be to use functional updates:
setInterval(() => {
 setCount(prev => prev + 1)
}, 1000)
This avoids holding unnecessary references to older state values.
Refs can sometimes retain large objects or DOM nodes in memory longer than expected. This is particularly common with media players and canvas elements.
const VideoPlayer = () => {
 const videoRef = useRef(null);

 useEffect(() => {
 if (videoRef.current) {
 videoRef.current.play();
 }
 }, []);

 return <video ref={videoRef} src="video.mp4" />;
};

export default VideoPlayer;
In this example, videoRef holds a reference to the <video> element.
When the VideoPlayer component unmounts, it could still hold a reference to the DOM element, which could prevent the garbage collector from freeing the memory used.
To avoid this, it’s good practice to clean up refs when the component unmounts.
const VideoPlayer = () => {
 const videoRef = useRef(null);

 useEffect(() => {
 if (videoRef.current) {
 videoRef.current.play();
 }

 // Clear the ref on unmount
 return () => {
 videoRef.current = null;
 };
 }, []);

 return <video ref={videoRef} src="video.mp4" />;
};
As I said earlier, detecting memory leaks can be hard and tedious. Fortunately, modern browsers provide tools that help you monitor how your application uses memory.
Learning how to use these tools is essential for identifying and diagnosing memory leaks in React apps.
Let’s look at a few of them and how they work.
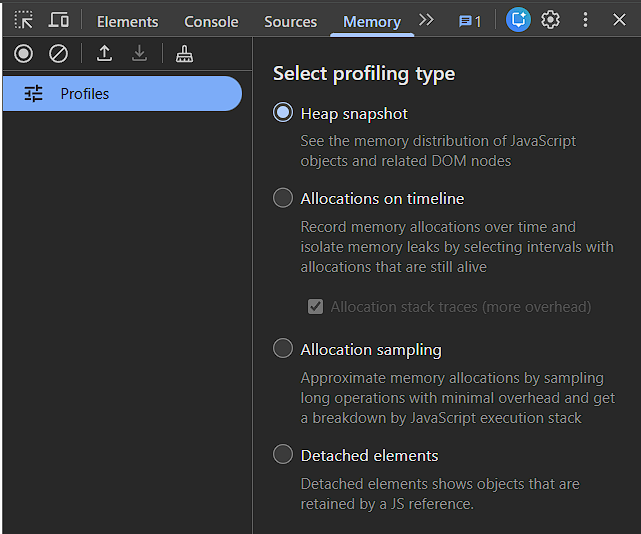
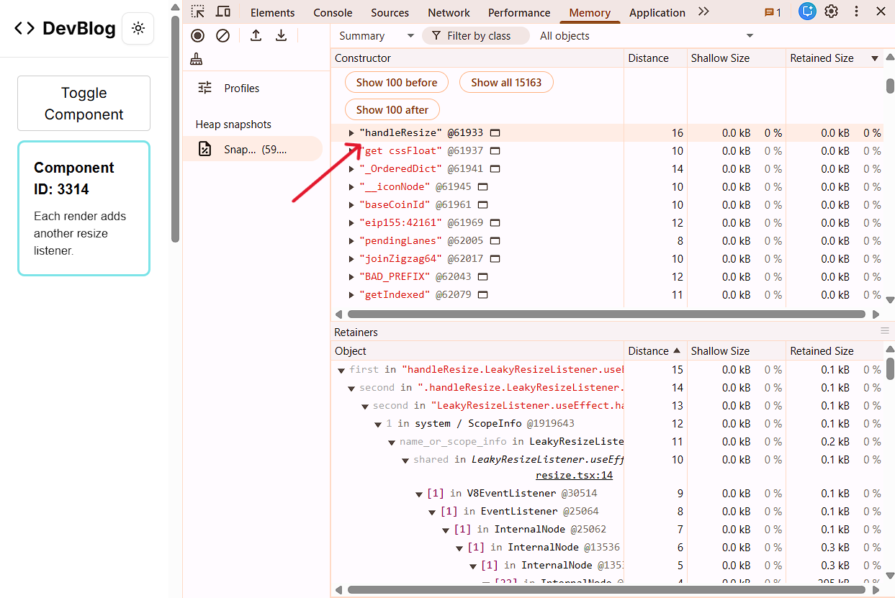
The Memory panel in Chrome DevTools is one of the most effective ways to detect memory leaks in web apps. It lets you capture memory snapshots and analyze how memory usage changes over time.
One useful feature is heap snapshots, which show all objects currently in memory and what’s keeping them alive.
To capture one, open Chrome DevTools and navigate to the Memory tab.
Select heap snapshot and take an initial snapshot.
At this point, you can search for the component or function you suspect might be leaking memory.
Press CTRL + F (or CMD + F on Mac) and look for the function name. If it still exists in memory, it will usually appear under the (string) category.
In my case, the handleResize function from the previous example shows up here, as seen below:
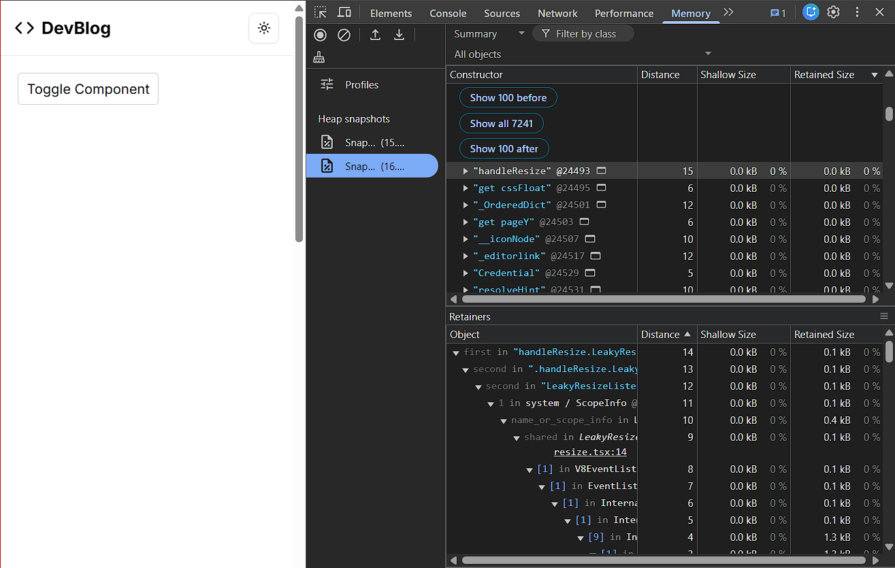
Next, go back to your app and perform actions like unmounting the component or navigating away.
Then, take another memory snapshot. Use the snapshot search bar to look for the function name again.
If the function still appears in memory, that’s a clear sign something is keeping it alive.
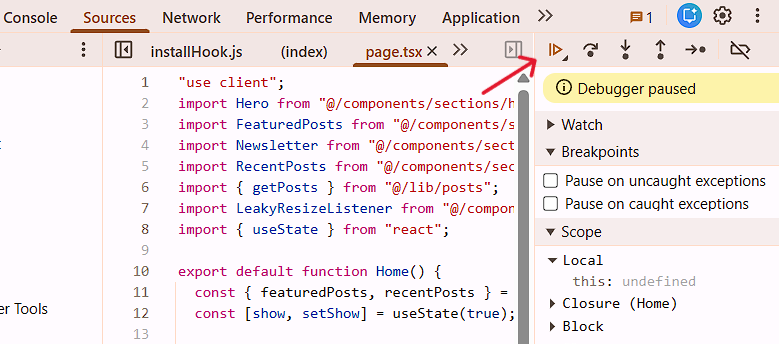
For more accurate results, let your app continue running before taking the second snapshot.
You can do this in the Sources tab by clicking the play icon at the top of the page.
The memory panel also provides other profiling tools, such as:
The React Developer Tools extension provides a Profiler that helps you analyze component rendering behavior.
While the profiler is primarily used to investigate performance issues, it can also provide clues about potential memory problems.
For example, the profiler can reveal:
If a component appears to stay mounted even after the UI should have removed it, it may indicate that some logic is preventing proper cleanup.
While these tools can help detect memory leaks, the best approach is to prevent them during development. Most leaks occur when side effects continue running after a component unmounts, so maintaining good cleanup habits is essential.
Memory leaks are a subtle but important performance issue in React applications. Because they develop gradually, they can go unnoticed until the application has been running for a long time.
By understanding the common causes of memory leaks, monitoring memory usage with developer tools, and following consistent cleanup patterns, you can build React applications that remain performant and reliable even during long user sessions.
Install LogRocket via npm or script tag. LogRocket.init() must be called client-side, not
server-side
$ npm i --save logrocket

// Code:

import LogRocket from 'logrocket';
LogRocket.init('app/id');
// Add to your HTML:

<script src="https://cdn.lr-ingest.com/LogRocket.min.js"></script>
<script>window.LogRocket && window.LogRocket.init('app/id');</script>
Claude Code vs. OpenCode in a real Next.js refactor: benchmark results, mistakes, prompts, and when to use each CLI agent.
Every time you explain your team’s coding standards to Claude, you are doing work that should be reusable. The same […]
Learn how to move beyond one-shot prompting in Claude with structured workflows for AI-assisted coding, debugging, PR reviews, documentation, testing, and automation.
Learn how to build advanced Next.js forms with rule engines, client-side previews, Server Actions, and server-validated form logic.
Would you be interested in joining LogRocket's developer community?
Join LogRocket’s Content Advisory Board. You’ll help inform the type of content we create and get access to exclusive meetups, social accreditation, and swag.
Sign up now