
<nowiki>Energiestatistik; energy statistics; إحصاءات الطاقة; Ενεργειακή στατιστική; Статистика енергетики; statistics applied to the field of energy; Στατιστική ενέργειας</nowiki>
statistics applied to the field of energy | |||||
| Upload media | |||||
| |||||
| 👁 Edit infobox data on Wikidata | |||||
See also:
- Category:Energy use
- Category:Energy by country - many statistics, charts, and graphs.
Subcategories
This category has the following 18 subcategories, out of 18 total.
- Energy statistics by country (20 C, 6 F)
- Energy statistics by type of energy (12 C, 2 F)
+
- Our World in Data - Energy and Environment (11 C, 48 P, 1299 F)
C
- Energy consumption statistics (7 C, 285 F)
- Energy costs (5 C, 22 F)
E
- Energy mix disclosure (15 F)
F
- Food energy statistics (16 F)
G
- Global energy statistics (3 C, 88 F)
I
- Information graphics about energy sources (2 C, 10 F)
L
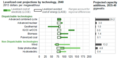
- Levelized cost of energy (30 F)
M
- Energy mix (2 C, 52 F)
P
- Primary energy (1 C, 4 P, 82 F)
- Energy production trends (3 C, 124 F)
R
- Energy reserves (1 C, 3 F)
Media in category "Energy statistics"
The following 102 files are in this category, out of 102 total.
-
Accumulated Cyclone Energy of North Atlantic hurricanes, OWID.svg 746 × 531; 46 KB
-
Annual-change-primary-energy-source (OWID 0060).png 850 × 600; 60 KB
-
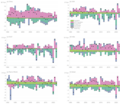
Annual-percentage-change-low-carbon (OWID 0101).png 850 × 600; 52 KB
-
Annual-primary-energy-fossil-vs-low-carbon (OWID 0096).png 850 × 600; 52 KB
-
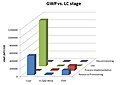
Balloon graph representing quality EROI.png 850 × 625; 217 KB
-
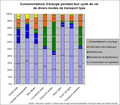
Besoins énergétiques des trois types de l'échelle de Kardashev.svg 949 × 249; 19 KB
-
Bilan GES filières energétiques.jpg 1,275 × 526; 65 KB
-
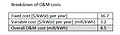
Breakcost.jpg 440 × 127; 49 KB
-
Capacidad por fuente Colombia 2005.svg 720 × 720; 17 KB
-
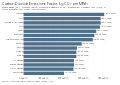
Carbon Dioxide Emissions Factor, kg CO₂ per MWh, OWID.svg 850 × 600; 9 KB
-
CarbonplotEU.png 949 × 731; 85 KB
-
Change-energy-gdp-per-capita (OWID 0164).png 850 × 600; 81 KB
-
Consommation mondiale d'énergie.svg 960 × 791; 70 KB
-
Consumo per Capita de Eletricidade em 2006 em kWh habitante.png 619 × 351; 48 KB
-
CONVENTIONALEIOLCA.jpg 761 × 504; 76 KB
-
Cost234.jpg 730 × 413; 69 KB
-
Costi MIT.png 1,128 × 816; 24 KB
-
Costo produzione elettricità con nucleare carbone gas.png 2,352 × 1,432; 79 KB
-
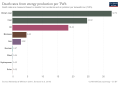
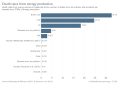
Death rates from energy production per TWh (including solar).svg 850 × 600; 27 KB
-
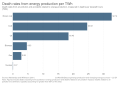
Death rates from energy production per TWh, OWID.svg 850 × 600; 6 KB
-
Death rates from energy production per TWh.png 792 × 518; 38 KB
-
Death rates from energy production, OWID.svg 850 × 600; 10 KB
-
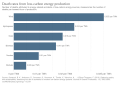
Death rates from low-carbon energy production, OWID.svg 850 × 600; 7 KB
-
Deaths per twh per energy source.jpg 1,812 × 1,084; 79 KB
-
EES EAEC. Энергетическая зависимость Греции, 1998-2019, проценты.svg 600 × 371; 150 KB
-
EffizienzLeistungFahrzeuge.png 1,198 × 855; 80 KB
-
Elec-fossil-nuclear-renewables (OWID 0268).png 850 × 600; 49 KB
-
Elec-mix-bar (OWID 0267).png 850 × 600; 69 KB
-
Energietraeger ww.png 470 × 480; 5 KB
-
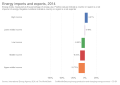
Energy imports and exports, OWID.svg 850 × 600; 5 KB
-
Energy intensity comparison (2004)-ar.svg 860 × 540; 72 KB
-
Energy intensity comparison (2004).svg 860 × 540; 10 KB
-
Energy Intensity.png 1,183 × 761; 14 KB
-
Energy pricing longterm.png 884 × 428; 126 KB
-
Energy pricing.png 950 × 445; 114 KB
-
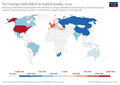
Energy-embedded-traded-goods (OWID 0360).png 850 × 600; 110 KB
-
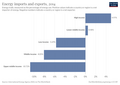
Energy-imports-and-exports-energy-use (OWID 0359).png 850 × 600; 49 KB
-
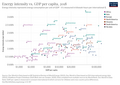
Energy-intensity-vs-gdp (OWID 0357).png 850 × 600; 110 KB
-
Energy-prices-50y.png 500 × 358; 30 KB
-
Energy-Units-01.png 12,976 × 9,676; 2.78 MB
-
Energy1.jpg 522 × 335; 52 KB
-
Energyfinal.jpg 700 × 497; 85 KB
-
Energyfinal3.jpg 732 × 486; 105 KB
-
Energyfinal4.jpg 747 × 483; 104 KB
-
ENVcoal.jpg 795 × 253; 127 KB
-
GDP per unit of energy use.png 874 × 434; 20 KB
-
Gdp vs tpe.jpg 1,181 × 834; 90 KB
-
Geografia2.jpg 604 × 353; 25 KB
-
GWPeiolca.jpg 713 × 475; 56 KB
-
GWPfinal.jpg 744 × 509; 88 KB
-
Health effects of energy production, OWID.svg 850 × 600; 7 KB
-
Hypothetical number of deaths from energy production, OWID.svg 850 × 600; 5 KB
-
Matriz energ mund 2007.jpg 483 × 425; 33 KB
-
Murphy et al 2022, EROI values for electricity.png 4,126 × 3,041; 139 KB
-
Nuke, coal, gas generating costs.png 1,844 × 1,246; 166 KB
-
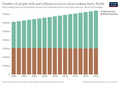
Number-with-without-clean-cooking-fuels (OWID 0714).png 850 × 600; 57 KB
-
Patents-energy-storage (OWID 0676).png 850 × 600; 61 KB
-
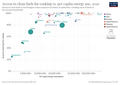
People-without-clean-cooking-fuels-region (OWID 0800).png 850 × 600; 58 KB
-
Per-capita-energy-source-stacked (OWID 0768).png 850 × 600; 93 KB
-
Per-capita-energy-stacked (OWID 0770).png 850 × 600; 93 KB
-
Percent of energy imported or exported by country.png 5,000 × 600; 114 KB
-
Percentage-change-energy-by-source (OWID 0852).png 850 × 600; 59 KB
-
Pollutantsfinal.jpg 710 × 469; 93 KB
-
PowerUserDistribution.png 1,213 × 909; 54 KB
-
Primaarenergia tarbimise struktuur aastal 2010 Norras.png 617 × 502; 15 KB
-
Primaarenergia tarbimise struktuur aastal 2010.jpg 524 × 354; 30 KB
-
Primaarenergia tarbimise struktuur Hispaanias.png 533 × 360; 13 KB
-
Primaarenergia.png 2,001 × 1,014; 29 KB
-
Primary-energy-fossil-nuclear-renewables (OWID 0804).png 850 × 600; 55 KB
-
Primary-energy-share-nuclear-renewables (OWID 0904).png 850 × 600; 55 KB
-
Primary-energy-source-bar (OWID 0906).png 850 × 600; 81 KB
-
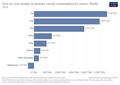
Production-consumption-carbon-intensity-energy (OWID 0899).png 850 × 600; 69 KB
-
Production-consumption-energy-per-person (OWID 0900).png 850 × 600; 61 KB
-
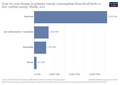
Production-vs-consumption-energy (OWID 0898).png 850 × 600; 64 KB
-
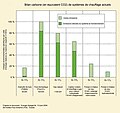
Profil écologique de systèmes de chauffage (1).jpg 850 × 800; 97 KB
-
Profil écologique de systèmes de chauffage (2).jpg 850 × 800; 86 KB
-
ReleasesEIOLOCA1.jpg 488 × 314; 48 KB
-
Releasesfinal.jpg 705 × 472; 99 KB
-
Share-elec-by-source (OWID 0925).png 850 × 600; 74 KB
-
Share-energy-source-sub (OWID 0913).png 850 × 600; 77 KB
-
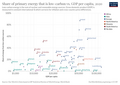
Share-of-low-carbon-energy-vs-gdp (OWID 0983).png 850 × 600; 94 KB
-
Spang-2014-The water consumption of energy production.tif 1,217 × 640; 2.98 MB
-
SpcialProgressIndexVsEnergInOilPerDay2.png 1,470 × 930; 122 KB
-
SrilankaEnergyStatistics.png 960 × 540; 32 KB
-
SrilankaEnergyStatisticsGWh.png 960 × 540; 37 KB
-
Stromproduktion in der Türkei nach Quellen.png 1,200 × 1,000; 61 KB
-
Sub-energy-fossil-renewables-nuclear (OWID 1072).png 850 × 600; 61 KB
-
Tagesverbrauch strom typisch.gif 826 × 568; 29 KB
-
Tas-gas&liquids-generation-Nov15-Mar16.svg 720 × 540; 1.02 MB
-
TasHydro-Nov.png 800 × 600; 80 KB
-
TezbaCernehoUhli.png 772 × 507; 15 KB
-
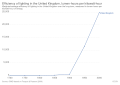
The price for lighting in the UK, OWID.svg 850 × 600; 11 KB
-
TPES 2010 estimate.jpg 729 × 545; 41 KB
-
Water Energy Nexus Full Report July 2014.tiff 1,429 × 967; 5.28 MB
-
সমগ্র বিশ্বের বার্ষিক শক্তির ব্যবহার.svg 911 × 661; 6 KB
.png)
.png)
.png)
.png)
.png)
.svg)
.png)
.png)
-ar.svg)
.svg)
.png)
.png)
.png)
.png)
.png)
.png)
.png)
.png)
.png)
.png)
.png)
.png)
.png)
.png)
.png)
.jpg)
.jpg)
.png)
.png)
.png)
.png)