The functions utag.view() and utag.link() are used to track page views and events, respectively. This article shows how to debug these functions to see how and when they are being called and what data is being processed.
Debug mode
To enable debug mode, open the developer console in your browser and run the following command:
document.cookie="utagdb=true";
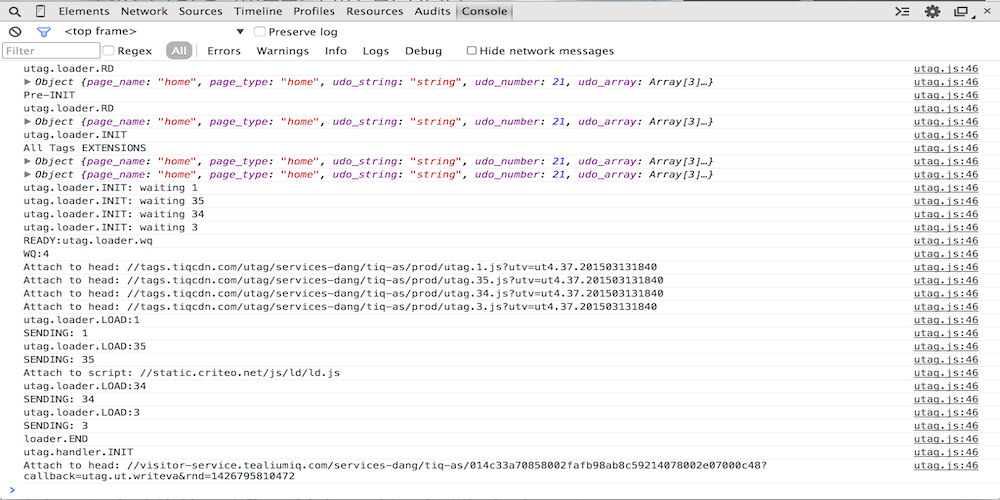
This cookie turns on debug mode which generates useful output to the console.
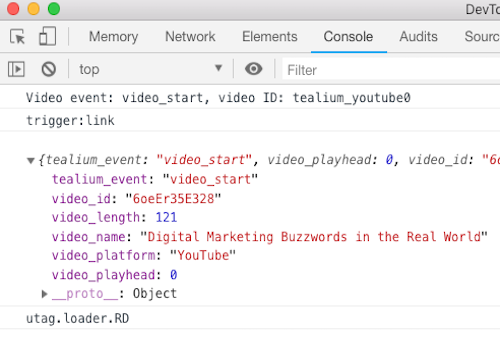
Click the line after trigger:view or trigger:link to expand and collapse the event data object.
Breakpoints
For more in-depth debugging, it is useful to set breakpoints in utag.js to pause the code when calls tracking calls occur. Use breakpoints to inspect the tracking data object or to inspect the stack trace to see where the call originated.
To use Chrome DevTools to set a breakpoint:
Open DevTools and go to the Sources tab, then open the file utag.js.
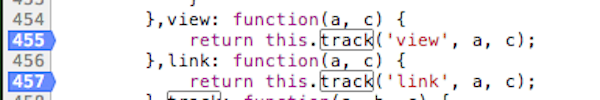
Find the line with return this.track( and click the line number to set a breakpoint: 👁 utag breakpoint
Return to the main window and perform an action to trigger a tracking call. When the tracking call runs, the code will pause on the breakpoint.
In the right panel, expand the Watch pane and click the + sign to add a watch expression. Type a and click Enter to add a watch expression for this variable.
Expand the object that is contained in parameter a to show the data that was passed to the tracking call. This data is available in extensions, load rules and data mappings.
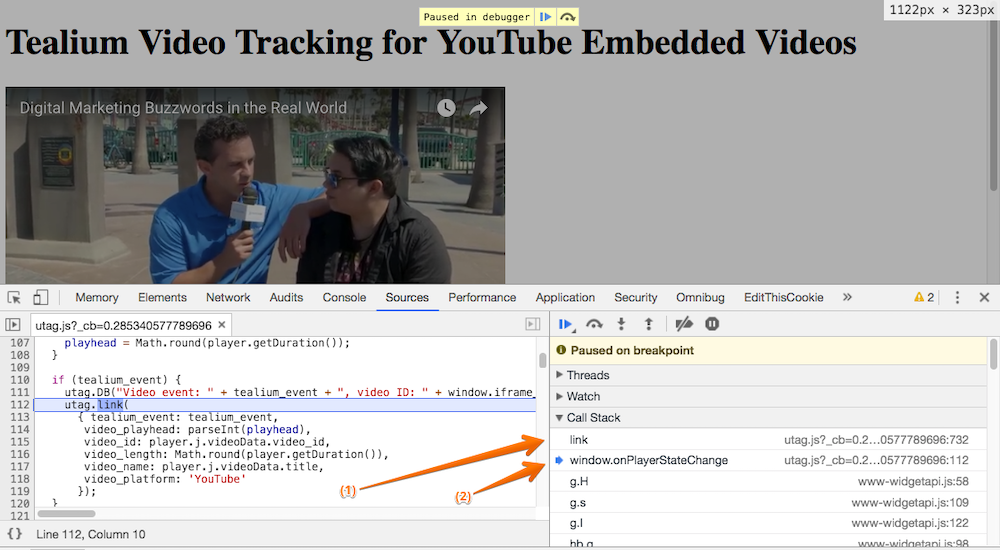
In the right panel, expand the Call Stack pane to see where the tracking call originated.
The following is an example of where to look for the location of a utag.link() call:
This example shows the breakpoint in utag.js that was placed to debug the utag.link() call. Item (2), when clicked, shows the utag.link() call that is made within the source code (to the left).
You have now successfully been able to debug three things:
Did the breakpoint get hit? If yes, then the function is set up to be triggered correctly.
Since the breakpoint was hit, you were able to see what data was sent when utag.view() or utag.link() was called.
You were able to view the actual configuration of the utag.view() or utag.link() call.
This is helpful when you are not seeing the correct data passed when certain events are triggered. It is likely that the data being sent in the function is incorrect.
This following table describes some of the important debug statements that appear in the console. The debug output on your site might vary slightly based on your version of utag.js or your specific settings.
Debug statement
Description
Pre-INIT
Extensions scoped to Pre Loader run.
PINIT
Extensions scoped to Before Load Rules run, load rules are evaluated, and tags are loaded.
