
- DZone
- Data Engineering
- Databases
- Discovering API Logs in Kibana
Discovering API Logs in Kibana
In this tutorial, see how to discover API logs in Kibana.
Join the DZone community and get the full member experience.
Join For FreeIn the IT world, one of the most challenging items is Monitoring. A 5-minute read out article shows you how to monitor or trace the API call in Kibana (https://www.elastic.co/kibana).
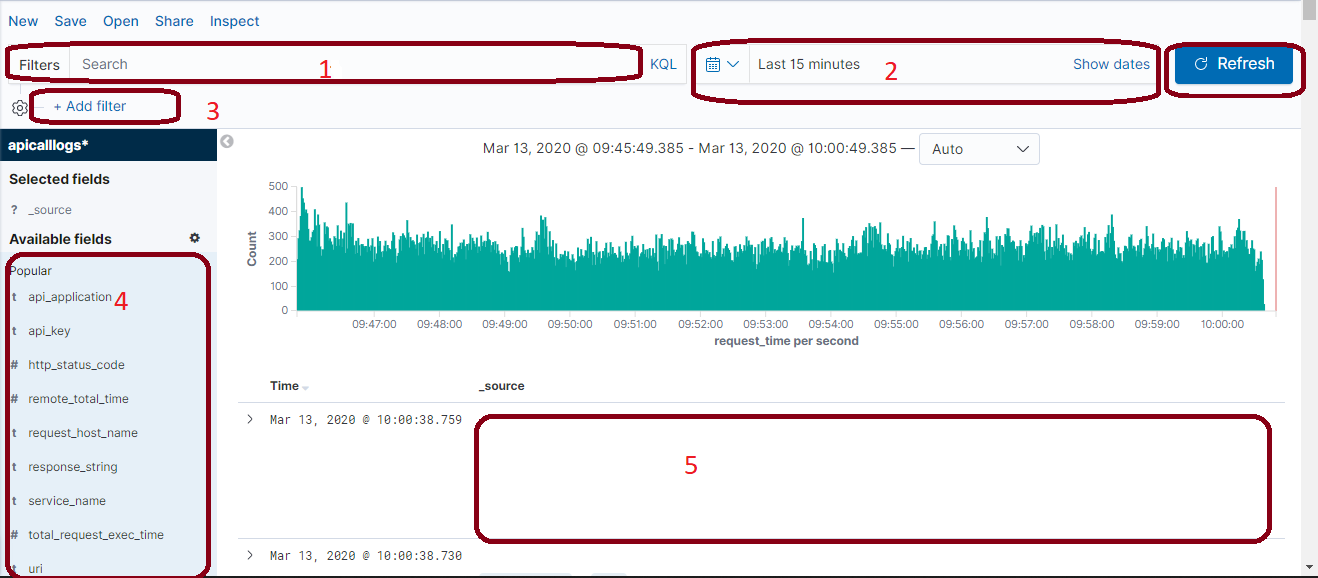
Once you log in to Kibana, there are 5 important sections:
1. Filter: Enter your API URI ex: /rest/getstock👁 Image
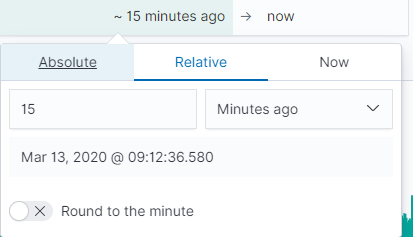
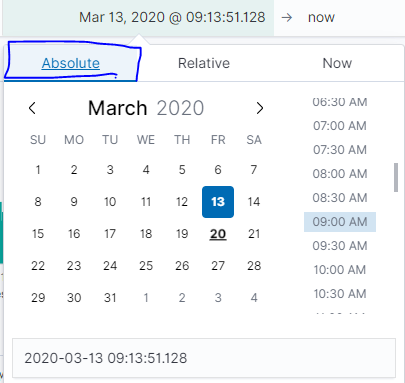
2. Filter by Time: Filter search to a particular time or date range.👁 Image
👁 Image
3. Add Filter👁 Image
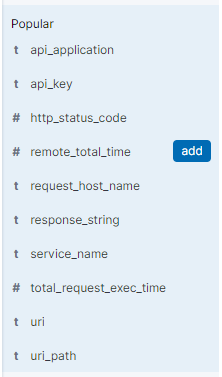
4. Different API Fields are useful for searching purposes.
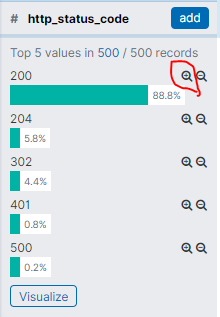
Usecase 1: Search by http_status code
- Step 1: Select the correct time on the top right.
- Step 2 : Left pan select the "Http_status_code" and press "Search Icon". It will automatically be added to the Add Filter.
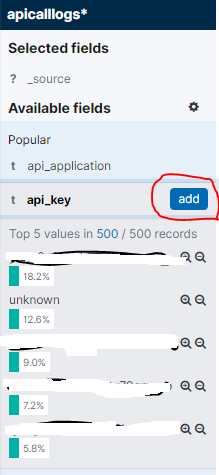
Use case 2: Search by API_KEY
- Step 1: Select the correct time on the top right.
- Step 2: Left pan select the "api_key" and press "Search Icon". It will automatically be added to the Add Filter.
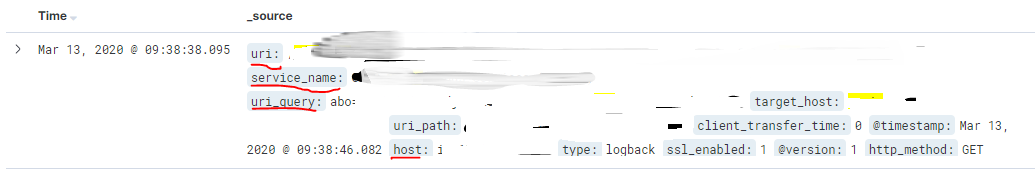
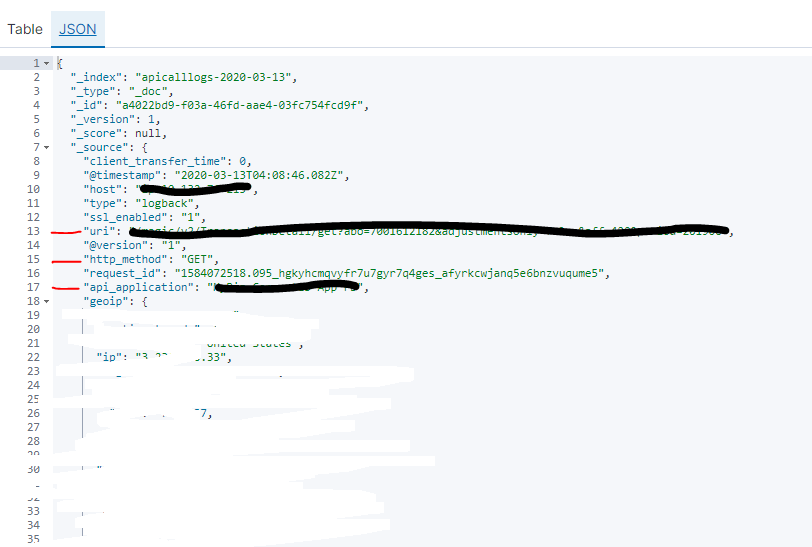
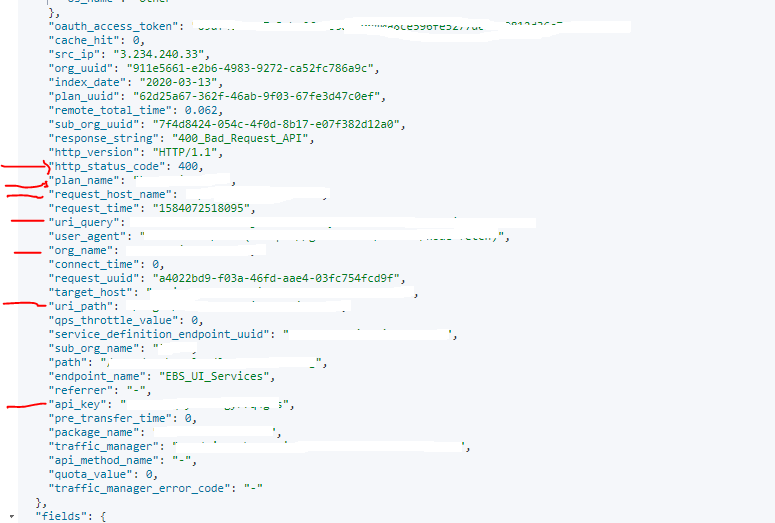
Use case 3: After setting all the filters needed, you want to check more details of the API:
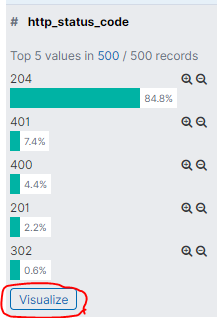
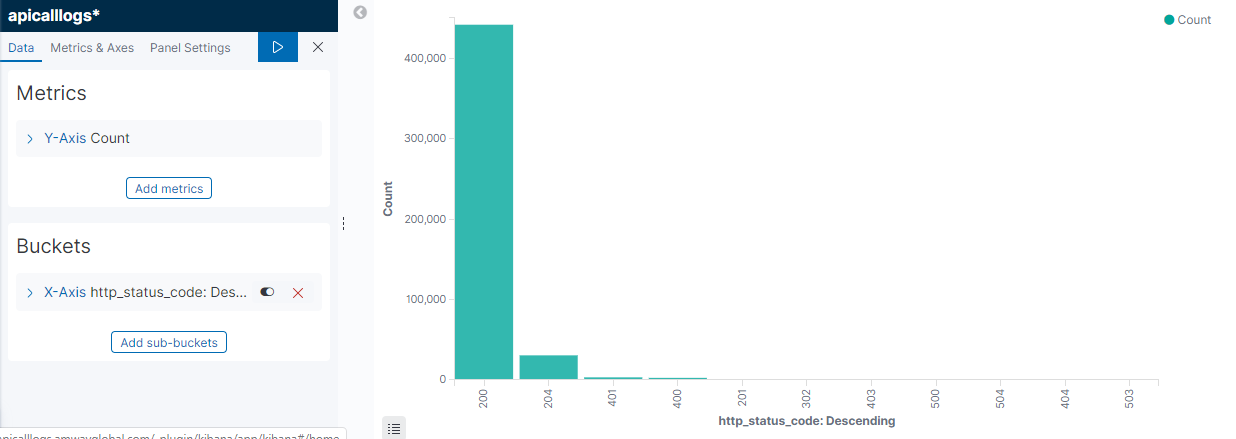
Use Case 4: Want to show a visual representation of the error code. Let select http_status_code from the left pan and press "Visualize"👁 Image
👁 Image
Thank you for reading. I hope this helps.
Opinions expressed by DZone contributors are their own.
Related
-
LLM: Trust, but Verify
-
Building a Unified API Using GraphQL Joins
-
What Is API-First?
-
Commonly Occurring Errors in Microsoft Graph Integrations and How To Troubleshoot Them (Part 4)