
- DZone
- Data Engineering
- AI/ML
- K-Means and SOM: Introduction to Popular Clustering Algorithms
K-Means and SOM: Introduction to Popular Clustering Algorithms
An accessible introduction to self-organizing map and k-means - two of the most widely applied clustering algorithms.
Join the DZone community and get the full member experience.
Join For Free
K-means and Kohonen SOM are two of the most widely applieddata clustering algorithms.
Although K-means is a simple vector quantization method and Kohonen SOM is a neural network model, they’re remarkably similar.
In this post, I’ll try to explain, in as plain a language as I can, how each of these unsupervised models works.
K-Means
K-means clustering was introduced to us back in the late 1960s. The goal of the algorithm is to find and group similar data objects into a number (K) of clusters.
By ‘similar’ we mean data points that are both close to each other (in the Euclidean sense) and close to the same cluster center.
The centroids in these clusters move after each iteration during training: for each cluster, the algorithm calculates the weighted average (mean) of all its data points and that becomes the new centroid.
K (the number of clusters) is a tunable hyperparameter. This means it’s not learned and we must set it manually.
This is how K-means is trained:
- Wegivethealgorithm a setofdatapointsand a numberKofclustersasinput.
- It places K centroids in random places and computes the distances between each data point and each centroid. We can use Euclidean, Manhattan, Cosine, or some other distance measure - the choice will depend on our specific dataset and objective.
- Thealgorithmassignseach data pointtotheclusterwhosecentroidisnearesttoit.
- The algorithm recomputes centroid positions. It takes all input vectors in a cluster and averages them out to figure out the new position.
- The algorithm keeps looping through steps 3 and 4 until convergence. Typically, we finish the training phase when the centroids stop moving and datapoints stop changing cluster assignments, or we can just tell the algorithm how many iterations we want.
K-means is easier to implement and fasterthan most other clustering algorithms, but it has some major flaws. Here are a few of them:
- With K-means, the end result of clustering will largely depend on the initial centroid placement.
- The algorithm is extremely sensitive to outliers and lacks scalability.
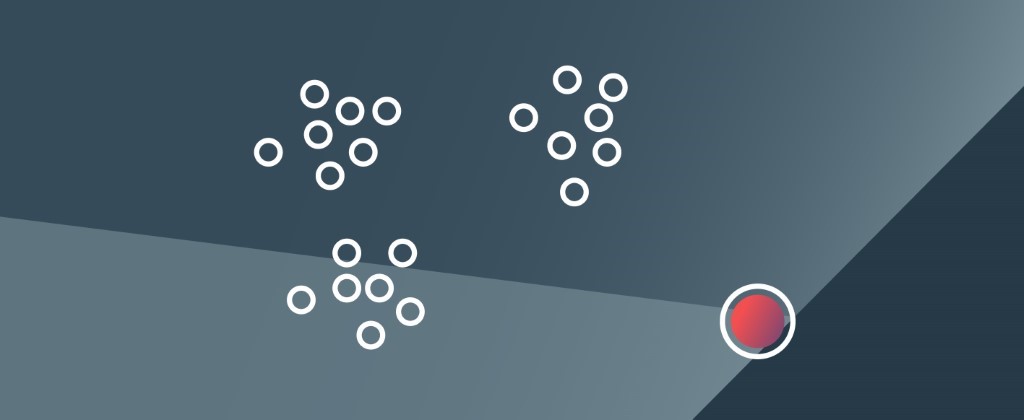
👁 Image
Outliers, like the one shown here, can really mess up the K-means algorithm.
- We need to specify K and it's not always obvious what the good value for K is (although there are a few techniques that can help figure out the optimal number of clusters such as the elbow method or the silhouette method)
- K-means only works on numerical variables (obviously, we can't compute a mean of categorical variables such as 'bicycle', 'car', 'horse', etc.)
- It performs poorly on high-dimensional data.
Kohonen Self-Organizing Map
The Kohonen SOMis anunsupervised neural network commonly used for high-dimensional data clustering.
Although it’s a deep learning model, its architecture, unlike that of most advanced neural nets, is fairly straightforward. It only has three layers.
- Inputlayer — inputsinan n-dimensionalspace.
- Weightlayer — adjustableweightvectorsthatbelongtothenetwork’sprocessingunits.
- Kohonen Layer — computational layer that consists of processing units organized in a 2D lattice-like structure (or 1D string-like structure.)
SOMs’ distinct property is that they can map high-dimensional input vectors onto spaces with fewer dimensions and preserve datasets' original topology while doing so.
The Self-Organization Process Has 4 Stages:
1. We initialize weight vectors values randomly.
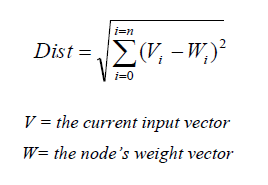
2. Each neuron computes its respective value of a discriminant function, which is typically the squared Euclidean distance between the neuron’s weight vector and the input vector, for each input pattern. The unit whose weight vector values are closest to those of the input is declared the winning node (the best matching unit).
We use this formula to calculate distances:
👁 Image
We take a row of inputs, calculate the difference between each input in that row and each neuron, square the results, and add them all up. The winning node will be the one with the smallest Euclidean distance.
3. A topological neighborhood of excited neurons emerges around the winning node.
Ourtopologicalneighborhoodformulalookslikethis:Tj,I(x) = exp(-S²j,I(x)/2σ²).
Sj,I —thelateraldistancebetweentwoneurons (j andI)
I(x) — thewinningneuron
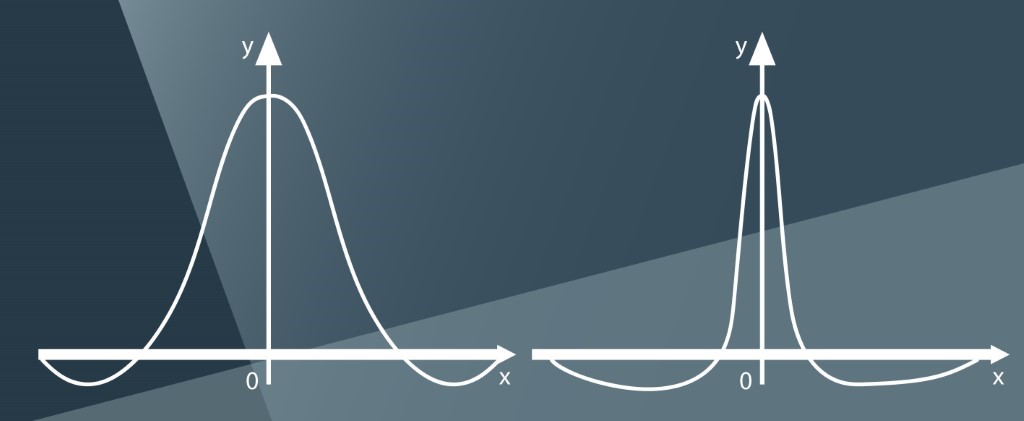
σ — the neighborhood size. The radius of a neighborhood in an SOM must decrease over time, and, usually, this is accomplished with theexponential decay function σ (t) = σ0exp(−t /λ)
4. The network updates its neurons’ weight vectors. All excited neurons adjust their weight vectors values to become more similar to input patterns. The winning unit’s weight vectors are moved closest to the input, and we adjust the weight vectors of the units in its neighborhood too, but to a lesser extent. The farther a unit is from the best matching unit, the less it’s modified.
Here is the weight update formula we use:∆wj,i = η(t)* Tj,I(x)(t)*(xi − wj,I)
η(t) — isthelearningrate
Tj,I(x)(t) — isthetopologicalneighborhood
t — epoch
i —neuron
j —anotherneuron
I(x) — best matching unit; the winning neuron
The winning neuron will have a topological neighborhood value of 1 (the distance between the winning neuron and itself is zero so exp(-S²j,I(x)/2σ²) will equal 1) which will magnify the learning rate η(t) and thus the unit will learn/change the most.
Anyotherneuronwillhave a lesservalueof exp(-S²j,I(x)/2σ²) and therefore the intensity of its adjustment won't be as great.
Given that neighborhoods in SOMs must shrink over time, Gaussian is typically the neighborhood function of choice: 👁 Image
Some Interesting SOM Applications:
A SOM was trained to create 3d models of human heads (3d images of faces were fed to it as input.) The researchers used the algorithm to build face models that carry key characteristics of faces and reflect different facial expressions.
These reconstructed heads, the paper says, can be used for emotion recognition too.
Analyzing Economic Stability With SOMs
This research shows that SOMs can be used to explore how financial markets organize during the critical periods of deflation and recession.
The researchers created a SOM-based representation of financial markets and used the SOM’s best matching units to build a corresponding Minimum Spanning Tree. Additionally, they built a global representation of countries’ financial situations that can help policymakers realize more efficient interventions during high-instability periods.
SOM for Hospital Data Interpretation
In most cases, trying to interpret highly complex hospital data with diagrams, graphs or 2D and 3D charts isn’t feasible. This paper describes how SOM networks can help clinicians/physicians easily understand statistical data from healthcare centers by providing intuitive visualizations. Moreover, these models can help spot correlations between different attributes of data and thus help medical professionals increase the quality and efficiency of care.
Opinions expressed by DZone contributors are their own.
Related
-
Discover Hidden Patterns with Intelligent K-Means Clustering
-
Navigating the Complexities of Text Summarization With NLP
-
Doubly Linked List in Data Structures and Algorithms
-
Linked List in Data Structures and Algorithms