
A complete guide to monitoring Claude Code in 2025
Last edited September 30, 2025
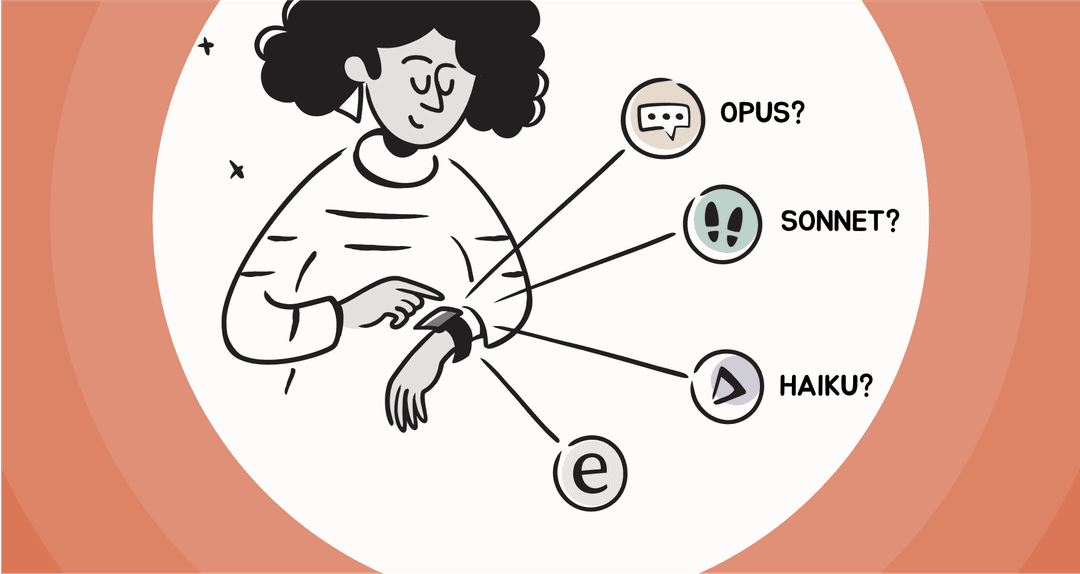
You’re deep in a coding session, the flow state is strong, and then it happens. Claude Code just stops. No warning, no error message, just silence. You’ve just hit one of its invisible usage limits, and your momentum is gone. It's a frustratingly common experience that brings your whole workflow to a grinding halt.
The real issue is that Anthropic’s Pro and Max plans run on rolling quotas that are notoriously difficult to track. You're left guessing how many tokens you have left or when your limit might reset, turning a powerful coding assistant into an unpredictable one. For anyone leading an engineering team, this ambiguity makes it nearly impossible to budget for AI tools or figure out if you're getting a good return on your investment (ROI).
This guide will walk you through the three main ways people are monitoring Claude Code, from simple local tools to full-blown observability platforms. The goal is to help you find the right solution to get back in control.
What is Claude Code and why is monitoring Claude Code so tricky?
For those who haven't used it, Claude Code is Anthropic's AI assistant built to help developers write, debug, and understand code right from their terminal. It's incredibly capable, but its subscription model brings a unique headache when you try to track how much you're using it.
From what we've seen in the developer community, here’s why monitoring Claude Code is such a pain:
Finally built a simple real-time token monitor for Claude Code. I was tired of flying blind and hitting the usage wall mid-sprint. It’s a basic script, but at least now I have a rough idea of my consumption.
-
Opaque limits: This isn't like a pay-per-token API where you can see every cent you spend. With Claude Code's subscriptions, you know there's a usage cap, but you don't know exactly what it is or how close you are to hitting it. There's no dashboard or progress bar to check.
-
Rolling time windows: Usage is often measured in five-hour blocks. This isn't a simple daily or monthly reset that you can set your watch to. It’s a constantly moving window, which makes it incredibly hard to predict when your quota will actually refresh. You might be good to go in an hour, or you might be stuck for the rest of the afternoon.
-
No native dashboard: Anthropic doesn’t give you a built-in tool to see your real-time token consumption. This leaves developers and their managers with two options: either fly blind and hope for the best, or go searching for a third-party solution to get the visibility they need.
This lack of transparency has pushed the developer community to build their own workarounds, which usually fall into one of three camps.
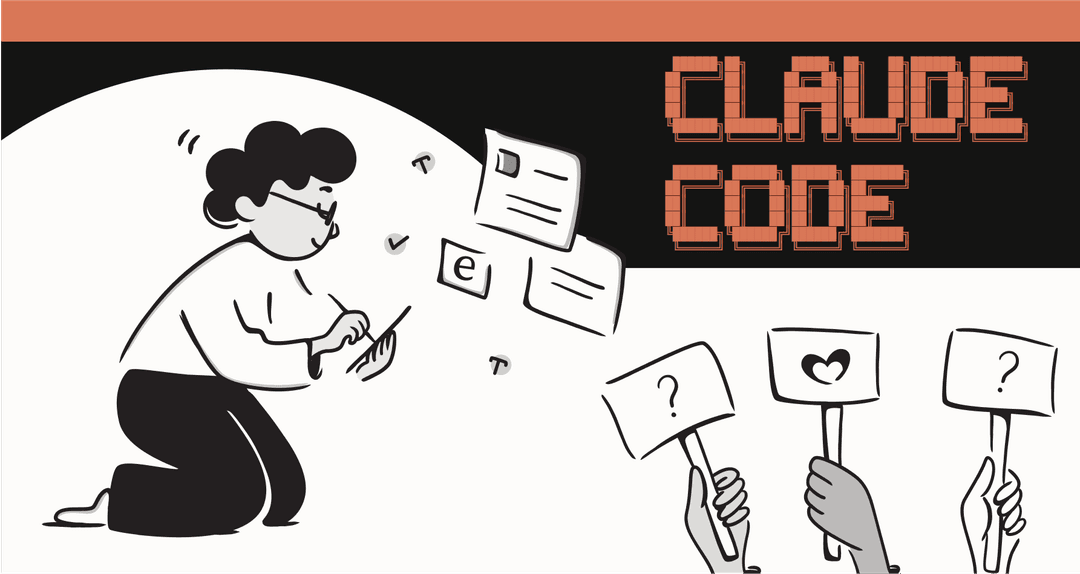
The three main ways to monitor Claude Code
To get around the visibility problem, developers have come up with a whole range of tools and workflows. Some are quick and simple fixes, while others are incredibly powerful but demand a serious engineering investment. Let's break down the three main approaches.
Method 1: Local CLI tools
The most straightforward way to start monitoring Claude Code is with a local command-line interface (CLI) tool. These are lightweight, open-source utilities that work by digging into the local log files (".jsonl") that Claude Code creates on your machine every time you use it.
A couple of popular options are "ccusage", which is fast and simple for generating reports, and "Claude-Code-Usage-Monitor", which gives you a more interactive, real-time dashboard right in your terminal.
Pros of local CLI tools:
-
They're simple to run. We're talking about running a single command right from your terminal. There's no complicated setup or server to provision. You just download the tool, point it at your log file, and get an instant reading. It's the kind of quick-and-dirty solution developers love for an immediate problem.
-
You get instant feedback. You don't have to wait for a report to be generated or a dashboard to refresh. You can see your personal token consumption in real time, which is perfect for knowing when you might need to slow down.
-
They're free and private. Since these tools are open-source and run entirely on your machine, your data and code snippets never leave your computer.
Cons of local CLI tools:
-
They're built for one person, not a team. A manager has no way to see what the whole team is using. This makes it impossible to track team-wide costs, understand adoption rates, or see if everyone is getting value out of the subscription.
-
They only look at one tool. These utilities are designed for Claude Code and nothing else. If your team is also using GitHub Copilot, a new testing AI, or any other tool, you're back to square one with no centralized view.
-
They're reactive, not strategic. A CLI tool can tell you how many tokens you've already used, but it can't offer any real insights. It won't tell you why a particular developer is burning through tokens or highlight knowledge gaps that are forcing your team to lean too heavily on the AI.
Method 2: Enterprise monitoring with OpenTelemetry (OTel)
For teams needing something with a bit more horsepower and a centralized view, Anthropic offers built-in support for sending out standardized metrics and logs through OpenTelemetry. This is pretty much the "official" way to do advanced monitoring.
The way it works is you configure your Claude Code CLI to send all its telemetry data to a specialized observability platform. This could be a self-hosted stack you build yourself with tools like Grafana, Prometheus, and Loki, or a managed service like SigNoz or Honeycomb. With this setup, you can build detailed dashboards to track dozens of metrics, from token counts and costs to API latency and usage patterns.
Pros of OpenTelemetry:
-
It's extremely powerful. You can track nearly every imaginable aspect of Claude Code usage with incredible detail. If you want to know the average response time for Python-related queries on Tuesday afternoons, you can probably build a chart for it.
-
You get a centralized, team-wide view. All the data from every developer can be collected into a single set of dashboards. This gives leaders a complete picture of how the tool is being used across the entire organization.
-
It's built on an industry standard. OpenTelemetry is a vendor-neutral, widely adopted standard for observability. This means you're not locking yourself into a proprietary ecosystem and can adapt your setup in the future.
Cons of OpenTelemetry:
-
It is incredibly complex to set up. Let's be clear: this isn't a tool, it's a full-blown engineering project. It requires deploying and configuring data collectors, time-series databases, log aggregation systems, and visualization layers. This can easily take weeks or even months to get right.
-
You need a specialist to drive it. Building meaningful dashboards requires a deep understanding of query languages like PromQL or LogQL. This is often outside the skillset of the engineering managers or team leads who actually need the insights.
-
It only tells you what happened, not why. An OTel stack is fantastic at showing you raw metrics (e.g., "we used 10 million tokens last week"). But it offers no qualitative insights into the reasons behind that usage or how to improve the workflows that led to it.
Method 3: Integrated AI platforms with built-in observability
The first two methods treat monitoring as an add-on, something you bolt onto a tool after you've already started using it. But what if observability was a core feature from the start? This is the approach taken by integrated AI platforms. After all, monitoring a developer tool is one thing, but monitoring the AI agents your customers and internal teams depend on every day requires a completely different solution.
Platforms like eesel AI provide complete AI solutions, such as support agents, copilots, and chatbots, with powerful analytics and reporting built-in from day one.
The eesel AI approach flips the script on monitoring:
-
You can get started in minutes, not months. Forget about complex OTel configurations and query languages. The analytics dashboard in eesel AI works automatically the moment you connect your helpdesk or knowledge sources.
-
The reports actually mean something for the business. The dashboards go beyond simple token counts. They're designed to give you business insights, like highlighting gaps in your knowledge base, identifying the top customer issues that are perfect for automation, and even forecasting resolution rates.
-
You can see what it'll do before you flip the switch. Before you even activate your AI agent, eesel AI can run a simulation on thousands of your past tickets. This gives you an accurate preview of how effective it will be and what your ROI could look like, something no local tool or generic observability platform can do.
Beyond monitoring Claude Code: Monitoring AI for support teams
The headaches of monitoring Claude Code are really just a small-scale version of a much bigger challenge that leaders in support, IT, and operations face when they deploy AI agents. These leaders need answers to critical business questions that developer-focused tools simply aren't built to answer:
-
What is the true ROI of our AI support agent?
-
Which customer tickets are being automated successfully, and which ones keep failing?
-
How can we find and fix the gaps in our documentation that are causing our AI to give up and escalate tickets to human agents?
This is where generic monitoring tools fall short. A Grafana dashboard can show you API latency, but it can't tell you that your AI is struggling because your onboarding docs are out of date. You need a platform that connects the AI's performance directly to your business operations.
A platform like eesel AI is built specifically for this. It unifies all your business knowledge, from Zendesk tickets and macros to Confluence pages and Google Docs, to give your AI the full picture. Its customizable workflow engine and built-in reporting give you total control and visibility over your AI operations. Plus, the pricing is transparent and predictable, with no surprise per-resolution fees that penalize you for successfully automating more work.
The goal shifts from just keeping an eye on a tool to actively managing and improving an entire AI-powered part of your business.
Choosing the right tool for monitoring Claude Code
Ultimately, mastering your Claude Code usage starts with having a clear view of what's going on. The right method really just depends on your needs.
-
Local tools: Great for a solo dev who just needs a quick, real-time check on their personal usage to avoid hitting those frustrating limits.
-
OTel stacks: The right choice for platform engineering teams that need deep, custom observability into how dev tools are used across the company and have the resources to build and maintain such a system.
-
Integrated platforms: The ideal solution for business leaders who need to manage, monitor, and optimize an entire AI-driven operation like customer support, with actionable insights and none of the setup overhead.
While monitoring usage is the first step, the real goal is to gain insights that improve performance, prove value, and drive better business outcomes.
If you’re ready to move beyond basic usage tracking and get true, actionable insights into your customer service AI, see how eesel AI provides out-of-the-box reporting, simulation, and workflow automation to put you in control. Start your free trial today.
Frequently asked questions
Share this article
Article by
Kenneth Pangan
Writer and marketer for over ten years, Kenneth Pangan splits his time between history, politics, and art with plenty of interruptions from his dogs demanding attention.