
👁 File:Internet Hosts Count log.svg
Size of this PNG preview of this SVG file: 600 × 480 pixels. Other resolutions: 300 × 240 pixels | 960 × 768 pixels | 1,280 × 1,024 pixels | 2,560 × 2,048 pixels.
Original file (SVG file, nominally 600 × 480 pixels, file size: 36 KB)
This is a file from the Wikimedia Commons. Information from its description page there is shown below.
Commons is a freely licensed media file repository. You can help.
Commons is a freely licensed media file repository. You can help.
| Description |
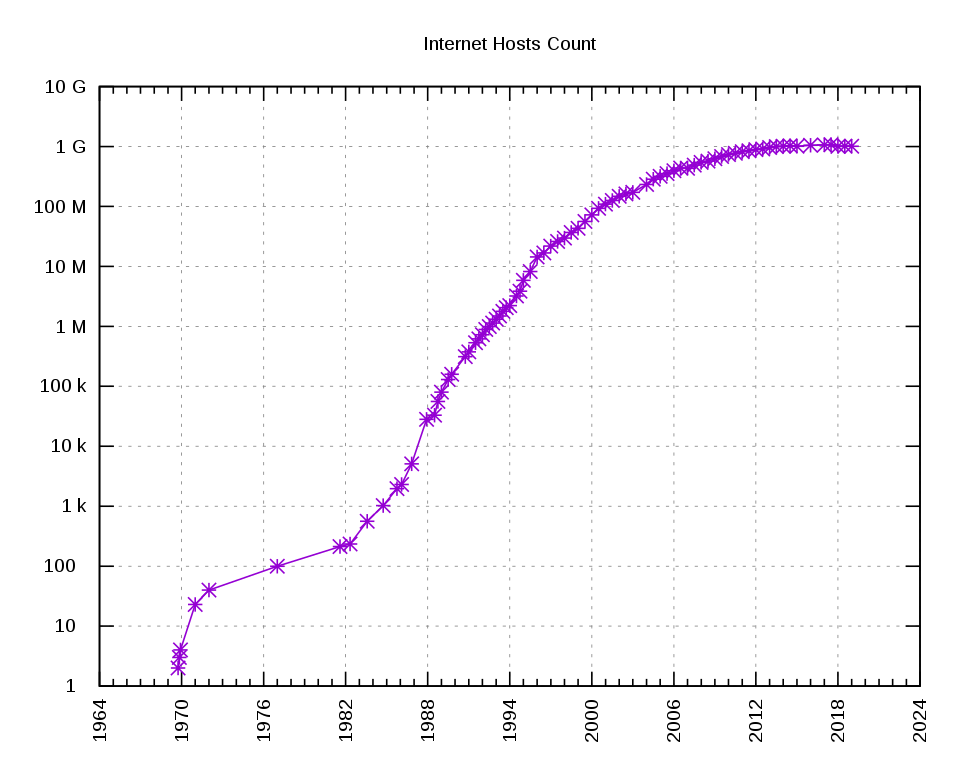
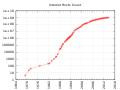
English: Internet host count, years on the x axis, number of hosts on the y axis, logplot, according to IETF |
||
| Date | |||
| Source | Own work | ||
| Author | Kopiersperre , Ke4roh | ||
| Permission (Reusing this file) |
I, the copyright holder of this work, hereby publish it under the following licenses: This file is licensed under the Creative Commons Attribution-Share Alike 3.0 Unported license.
You may select the license of your choice. |
||
| Other versions |
File:Internet host count 1988-2012 log scale.png: |
||
| SVG development InfoField |
Code for generating this chart and its compiled data, including a reference for each data point, are at [1]
File history
Click on a date/time to view the file as it appeared at that time.
File usage
The following 5 pages use this file:
Global file usage
The following other wikis use this file:
- Usage on ar.wikipedia.org
- Usage on ast.wikipedia.org
- Usage on de.wikipedia.org
- Usage on el.wikipedia.org
- Usage on es.wikipedia.org
- Usage on eu.wikipedia.org
- Usage on fa.wikipedia.org
- Usage on hi.wikipedia.org
- Usage on hy.wikipedia.org
- Usage on km.wikipedia.org
- Usage on ko.wikipedia.org
- Usage on ky.wikipedia.org
- Usage on pnb.wikipedia.org
- Usage on ru.wikipedia.org
- Usage on ta.wikipedia.org
- Usage on te.wikipedia.org
- Usage on th.wikipedia.org
- Usage on tl.wikipedia.org
- Usage on tr.wikipedia.org
- Usage on uk.wikipedia.org
- Usage on ur.wikipedia.org
- Usage on vi.wikipedia.org
- Usage on zh.wikipedia.org
Metadata
This file contains additional information, probably added from the digital camera or scanner used to create or digitize it.
If the file has been modified from its original state, some details may not fully reflect the modified file.
| Short title | Gnuplot |
|---|---|
| Image title | Produced by GNUPLOT 5.0 patchlevel 6 |
| Width | 600 |
| Height | 480 |
Retrieved from "https://en.wikipedia.org/wiki/File:Internet_Hosts_Count_log.svg"