
igraph python (How it Works for Developers)
Graphs and complex network research are basic notions of computer science and mathematics used to model complex linkages and interactions. The nodes, sometimes also called vertices, and edges, sometimes referred to as links, of a graph are, in essence, merely visual representations and interpretations of an entity and its relationships, shown through the edges that connect nodes.
More generally, all the graphs used for transportation systems, social networks, and communication networks are considered to be networks. By looking at graphs and networks, we can understand and overcome problems related to connectivity, flow, and network structure. Such work provides insight into a diversity of fields, from social dynamics and organizational structure to algorithms for efficient routing and optimization. These concepts are very central in network theory, operations research, and data science.
In this article, we use igraph to show how you can generate network graphs and print them into a PDF file using the flexible and reliable IronPDF library.
What is igraph?
Igraph is a strong Python package for generating, manipulating, and analyzing complex graphs and networks. It provides an enormous toolkit to deal with graphs, from generation to manipulation and their visualization. Python igraph facilitates the implementation of network analysis through many algorithms computing various metrics of centrality, shortest paths, community structure, and even more.
This library thus provides good visualization with adaptive layouts and properties for directed and undirected graphs. Igraph is very flexible and fast, and it is often found in applications for the analysis of difficult relational data, such as in data science, computational biology, and social network studies.
👁 igraph python (How it Works for Developers): Figure 1 - Igraph webpage
Setting Up and Using the igraph Python Package
To begin with fundamental graph theory operations and configurations in Python, use the following steps to create, configure, and use igraph for yourself.
Installing the igraph Package
You must install the igraph package first. The following pip command can be used for this:
pip install igraphpip install igraphCreating a Graph Using Igraph
Here's a simple example to show you how to use igraph to construct and set up a graph:
from igraph import Graph, plot
# Create an empty graph
g = Graph()
# Add vertices (nodes)
g.add_vertices(5) # Adding 5 vertices
# Add edges (connections between vertices)
g.add_edges([(0, 1), (1, 2), (2, 3), (3, 4), (4, 0), (0, 2)]) # Adding edges
# Add vertex ids and edge attributes
g.vs["name"] = ["A", "B", "C", "D", "E"] # Vertex labels
g.es["weight"] = [1, 2, 3, 4, 5, 6] # Edge weights
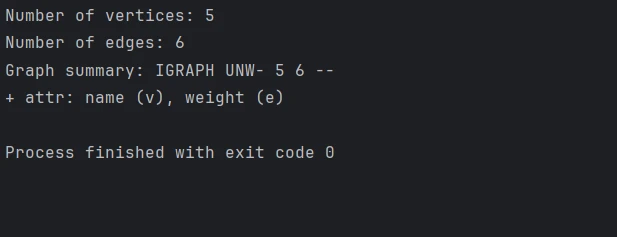
# Print basic graph structural properties
print("Number of vertices:", g.vcount())
print("Number of edges:", g.ecount())
print("Graph summary:", g.summary())from igraph import Graph, plot
# Create an empty graph
g = Graph()
# Add vertices (nodes)
g.add_vertices(5) # Adding 5 vertices
# Add edges (connections between vertices)
g.add_edges([(0, 1), (1, 2), (2, 3), (3, 4), (4, 0), (0, 2)]) # Adding edges
# Add vertex ids and edge attributes
g.vs["name"] = ["A", "B", "C", "D", "E"] # Vertex labels
g.es["weight"] = [1, 2, 3, 4, 5, 6] # Edge weights
# Print basic graph structural properties
print("Number of vertices:", g.vcount())
print("Number of edges:", g.ecount())
print("Graph summary:", g.summary())Console Output
👁 igraph python (How it Works for Developers): Figure 2 - Console output from the code example
Configure Graph Layout and Visualization
We can draw the graph using some of igraph's inbuilt features. Change the appearance and layout with the following:
# Define a layout for the graph
layout = g.layout("circle") # Layout in a circular arrangement

# Plot the graph with labels and custom options
plot(
 g,
 layout=layout,
 vertex_label=g.vs["name"], # Label vertices
 vertex_color="lightblue", # Vertex color
 edge_width=g.es["weight"], # Edge width based on weight
 vertex_size=30, # Vertex size
 edge_color="grey", # Edge color
 bbox=(300, 300), # Size of the plot
 margin=20 # Margin around the plot
)

# Save the plotted graph to a file
plot(g, layout=layout, bbox=(300, 300), margin=20).save('exampleGraph.png')
# Define a layout for the graph
layout = g.layout("circle") # Layout in a circular arrangement
# Plot the graph with labels and custom options
plot(
g,
layout=layout,
vertex_label=g.vs["name"], # Label vertices
vertex_color="lightblue", # Vertex color
edge_width=g.es["weight"], # Edge width based on weight
vertex_size=30, # Vertex size
edge_color="grey", # Edge color
bbox=(300, 300), # Size of the plot
margin=20 # Margin around the plot
)
# Save the plotted graph to a file
plot(g, layout=layout, bbox=(300, 300), margin=20).save('exampleGraph.png') Outputted Graph
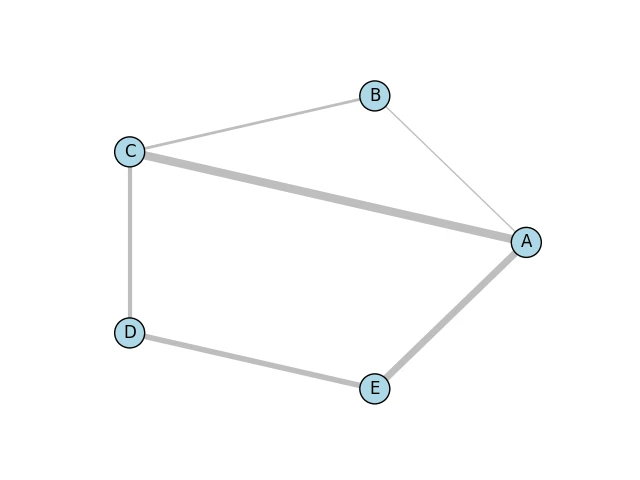
Below is the simple graph image that has been generated with the help of the Matplotlib library and the Python bindings of the Cairo library.
👁 igraph python (How it Works for Developers): Figure 3 - Outputted graph
Advanced Graph Operations
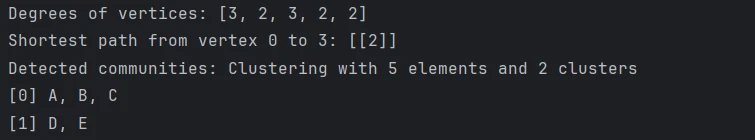
Perform various graph operations and analyses, such as calculating centrality, finding communities, or identifying shortest paths:
# Calculate degree centrality for each vertex
degrees = g.degree()
print("Degrees of vertices:", degrees)

# Compute shortest path between two vertices that don't have a predefined distance
shortest_path = g.shortest_paths_dijkstra(source=0, target=3)
print("Shortest path from vertex 0 to 3:", shortest_path)

# Detect communities using the Louvain method
communities = g.community_multilevel()
print("Detected communities:", communities)
# Calculate degree centrality for each vertex
degrees = g.degree()
print("Degrees of vertices:", degrees)
# Compute shortest path between two vertices that don't have a predefined distance
shortest_path = g.shortest_paths_dijkstra(source=0, target=3)
print("Shortest path from vertex 0 to 3:", shortest_path)
# Detect communities using the Louvain method
communities = g.community_multilevel()
print("Detected communities:", communities)Console Outputs
Introducing IronPDF
👁 igraph python (How it Works for Developers): Figure 5 - IronPDF webpage
We can even generate and edit PDFs programmatically using the IronPDF Python module. Using this library, you will have an enormous capability to create PDF documents from HTML, merge two or more PDF documents, and even make use of existing PDFs and modify them to include text, photos, and annotations. IronPDF enables you to generate professional-quality PDFs from any HTML site or Web content suitable for generating reports, invoices, and other documents that have preset styles.
Some of its advanced features include editing page layouts, document encryption, and text extraction from a PDF. It will help developers be better positioned to improve the general usefulness of your products if they can handle PDFs better.
Installing the IronPDF Library
You can use the following command to install the packages that allow the Python interface to enable IronPDF capabilities for your project:
pip install ironpdf
Integrating igraph with IronPDF
These are the steps you would take in Python to merge igraph and IronPDF: First, you will create a graph with igraph and display it. Then, turn the resulting visualization into a PDF.
from igraph import Graph, plot
import matplotlib.pyplot as plt
from ironpdf import ImageToPdfConverter, License
import warnings

# Suppress warnings for cleaner output
warnings.filterwarnings('ignore')

# Ensure that you have replaced the string with your own license key
License.LicenseKey = "YOUR LICENSE KEY GOES HERE"

# Create an empty graph
g = Graph()

# Add adjacent vertices (nodes)
g.add_vertices(5) # Adding 5 vertices

# Add edges (connections between vertices)
g.add_edges([(0, 1), (1, 2), (2, 3), (3, 4), (4, 0), (0, 2)]) # Adding edges

# Add vertex and edge attributes
g.vs["name"] = ["A", "B", "C", "D", "E"] # Vertex labels
g.es["weight"] = [1, 2, 3, 4, 5, 6] # Edge weights

# Define a layout for the graph
layout = g.layout("circle") # Layout in a circular arrangement

# Create a plot using matplotlib
fig, ax = plt.subplots()

# Plot the graph with specified layout and styles
plot(
 g,
 target=ax,
 layout=layout,
 vertex_label=g.vs["name"], # Label vertices
 vertex_color="lightblue", # Vertex color
 edge_width=g.es["weight"], # Edge width based on weight
 vertex_size=30, # Vertex size
 edge_color="grey", # Edge color
 bbox=(300, 300), # Size of the plot
 margin=20 # Margin around the plot
)

# Save the plot as a PNG image
plt.savefig('result.png')

# Convert the image to a PDF file
ImageToPdfConverter.ImageToPdf('result.png').SaveAs("result.pdf")
from igraph import Graph, plot
import matplotlib.pyplot as plt
from ironpdf import ImageToPdfConverter, License
import warnings
# Suppress warnings for cleaner output
warnings.filterwarnings('ignore')
# Ensure that you have replaced the string with your own license key
License.LicenseKey = "YOUR LICENSE KEY GOES HERE"
# Create an empty graph
g = Graph()
# Add adjacent vertices (nodes)
g.add_vertices(5) # Adding 5 vertices
# Add edges (connections between vertices)
g.add_edges([(0, 1), (1, 2), (2, 3), (3, 4), (4, 0), (0, 2)]) # Adding edges
# Add vertex and edge attributes
g.vs["name"] = ["A", "B", "C", "D", "E"] # Vertex labels
g.es["weight"] = [1, 2, 3, 4, 5, 6] # Edge weights
# Define a layout for the graph
layout = g.layout("circle") # Layout in a circular arrangement
# Create a plot using matplotlib
fig, ax = plt.subplots()
# Plot the graph with specified layout and styles
plot(
g,
target=ax,
layout=layout,
vertex_label=g.vs["name"], # Label vertices
vertex_color="lightblue", # Vertex color
edge_width=g.es["weight"], # Edge width based on weight
vertex_size=30, # Vertex size
edge_color="grey", # Edge color
bbox=(300, 300), # Size of the plot
margin=20 # Margin around the plot
)
# Save the plot as a PNG image
plt.savefig('result.png')
# Convert the image to a PDF file
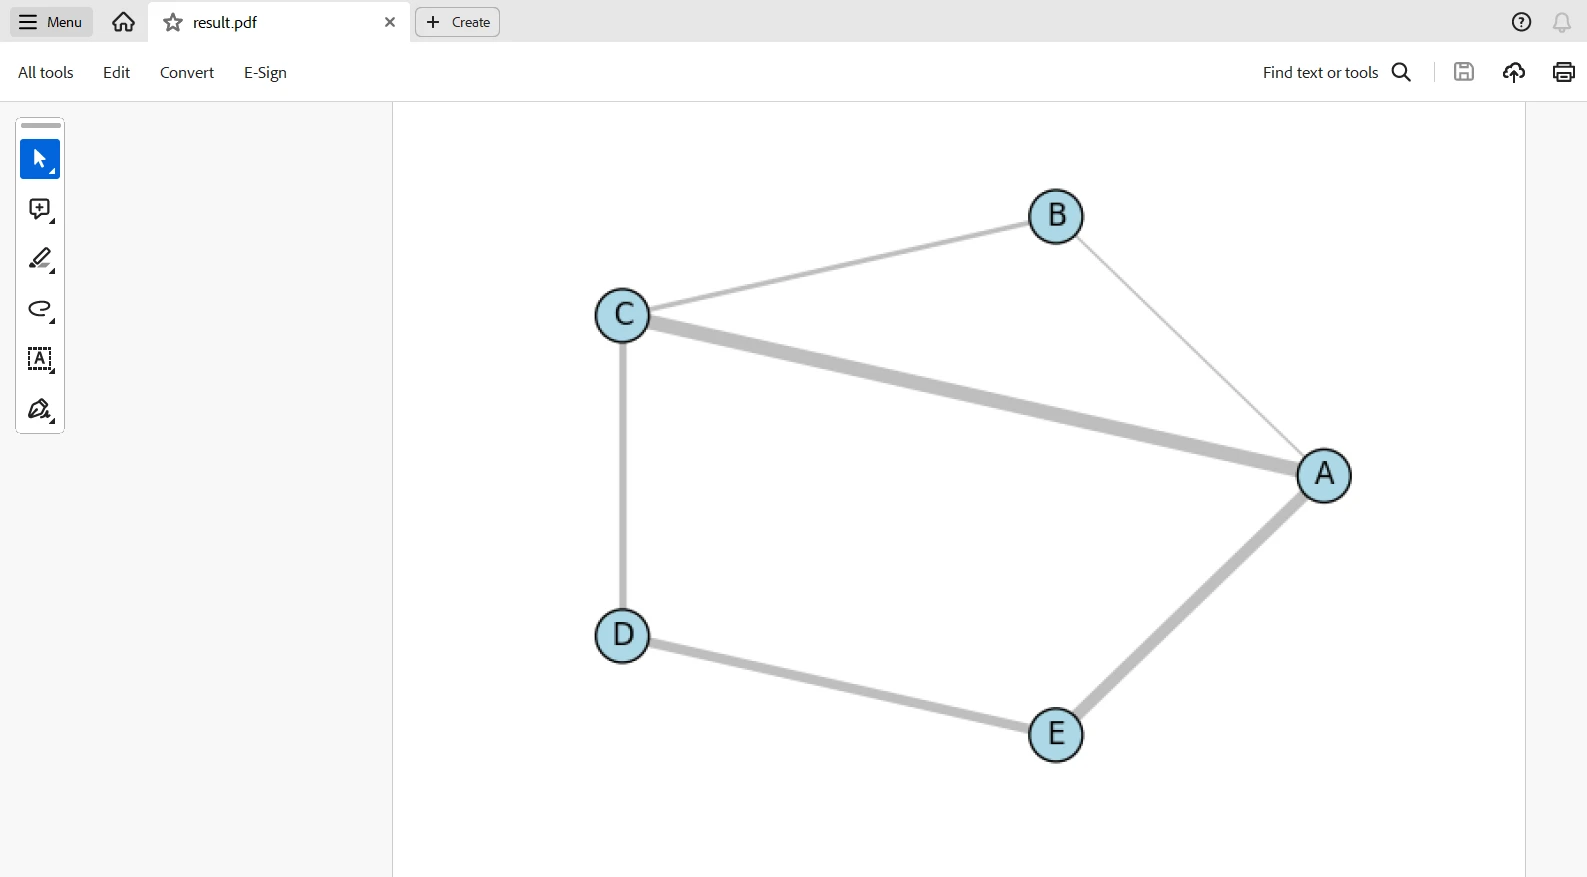
ImageToPdfConverter.ImageToPdf('result.png').SaveAs("result.pdf")This script will generate a graph through igraph, visualize it with matplotlib, and then use IronPDF to turn the chart into a PDF. This code will import all necessary libraries and set up IronPDF with a license key. Create an empty graph with five vertices and six edges and add weights and labels for clarity.
The graph is laid out circularly, and the plotting involves matplotlib with several visualization properties, such as vertex color and size, and edge line widths. After that, the result—as an image file, result.png, is saved. Finally, it is transformed into a PDF, result.pdf, with IronPDF's ImageToPdfConverter. Graph creation, visualization, and PDF production are combined into one workflow.
Outputted PDF
👁 igraph python (How it Works for Developers): Figure 6 - Outputted PDF
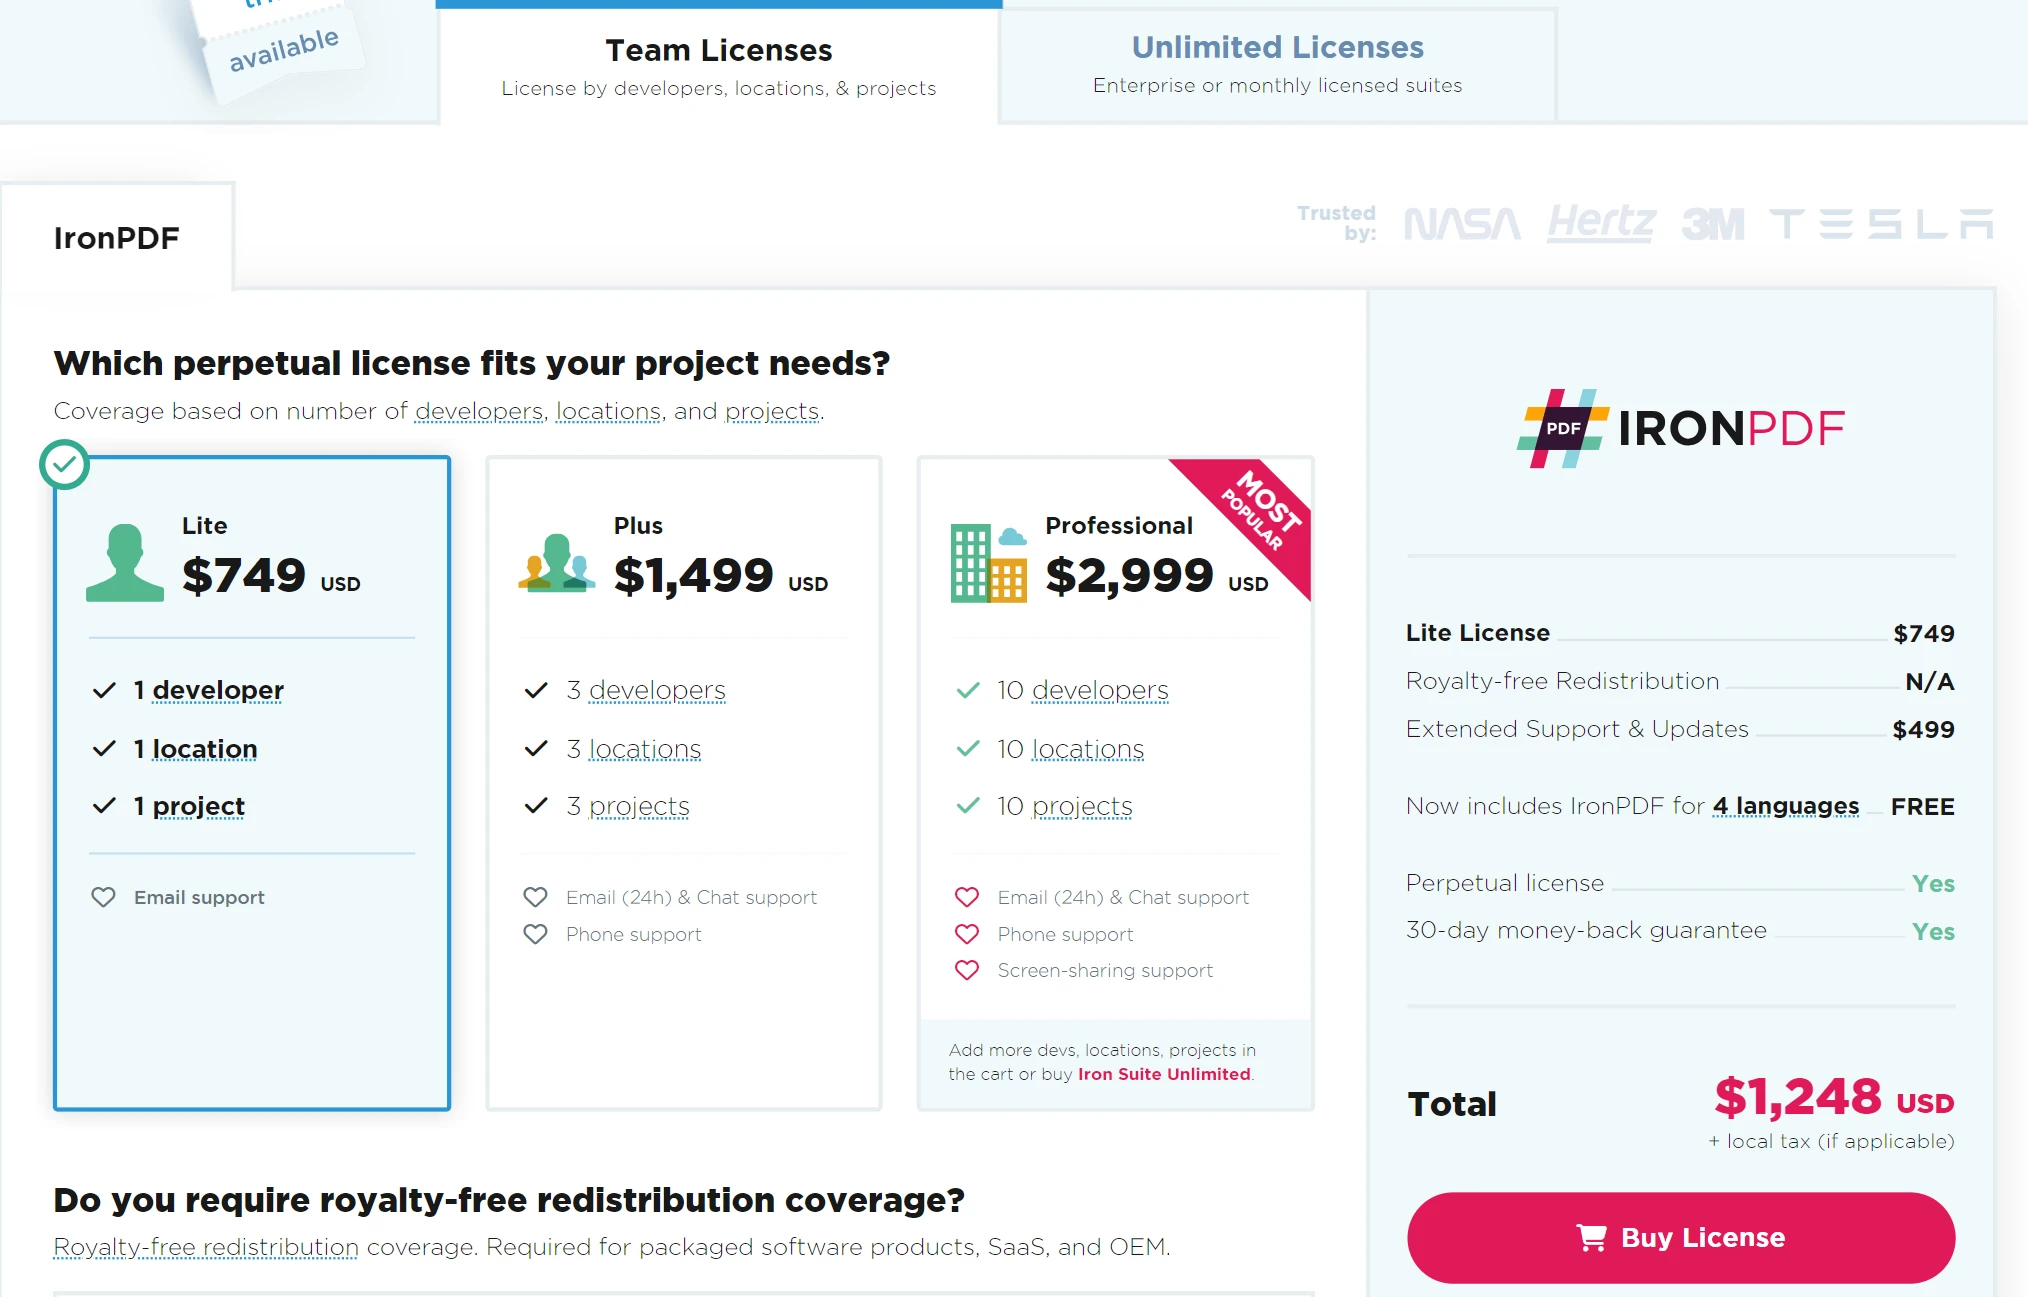
Licensing
A licensing key is needed to allow the code to work without a watermark. You can register for a free trial license at this link. Note that you can register for one without providing proof of identity. All you need to do to register for the free trial version is to input your email address.
👁 igraph python (How it Works for Developers): Figure 7 - IronPDF licensing plan
Conclusion
With the power of IronPDF and igraph, you can develop solutions for visualizing and presenting complex graph data. Through igraph, you can easily create and analyze complex networks, while using IronPDF for the seamless conversion of data visualizations into professional-grade PDF documents. These combined forces will help you develop comprehensive reports, including both graph analyses and visual representations.
This integration enables the development of various applications that demand comprehensive network documentation, including academic research, business analytics, and data-driven reporting. Furthermore, it combines high-quality document output with very powerful manipulation capabilities with graphs. On top of all that, Iron Software provides a multiplicity of libraries, making it easier to develop applications for a range of platforms and operating systems like Windows, Android, MAC, Linux, and others.