
Plots is an open source graph plotting application that makes it easy to visualize mathematical formulae. You can use it for trigonometric, hyperbolic, exponential and logarithmic functions along with arbitrary sums and products.
Plot mathematical graphs with Plots on Linux
Plots is a simple application inspired by graph plotting web apps like Desmos. It allows you to plot graphs of different math functions, which you can enter interactively, as well as customizing the color of your plots.
Written in Python, Plots takes advantage of modern hardware using OpenGL. It uses GTK 3 and thus integrates well with the GNOME desktop.
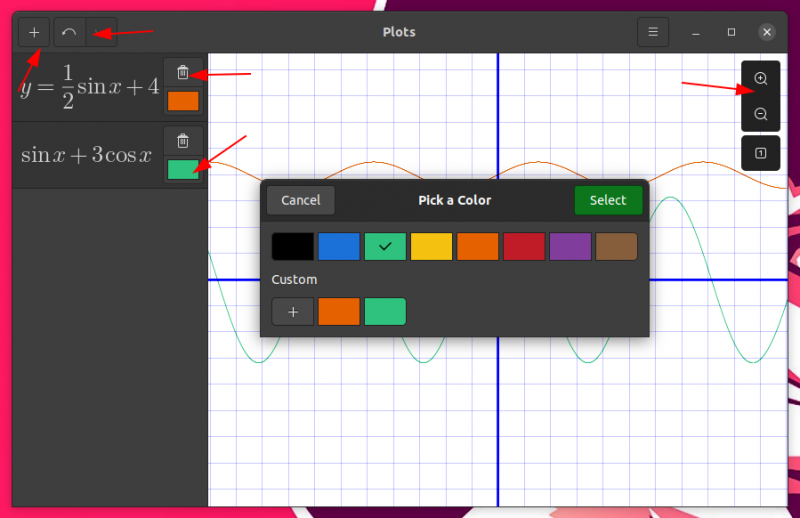
Using plots is straightforward. To add a new equation, click the plus sign. Clicking the trash icon deletes the equation. There is also the option to undo and redo. You can also zoom in and zoom out.
The text box where you type is equation friendly. The hamburger menu has a ‘help’ option to access the documentation. You’ll find useful tips on how to write various mathematical notations here. You can also copy-paste the equations.
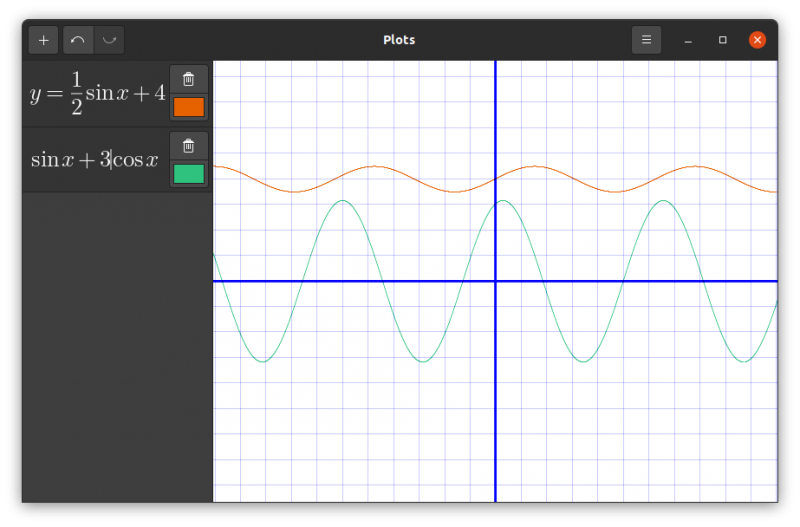
In dark mode, the sidebar equation area turns dark but the main plotting area remains white. I believe that’s by design perhaps.
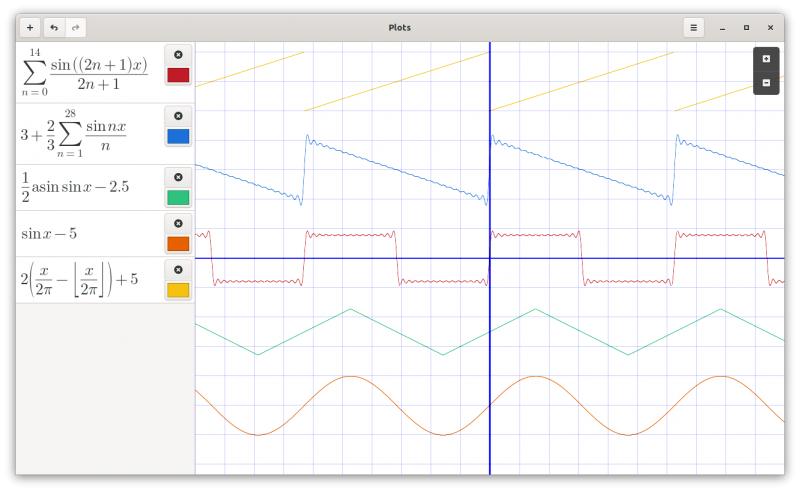
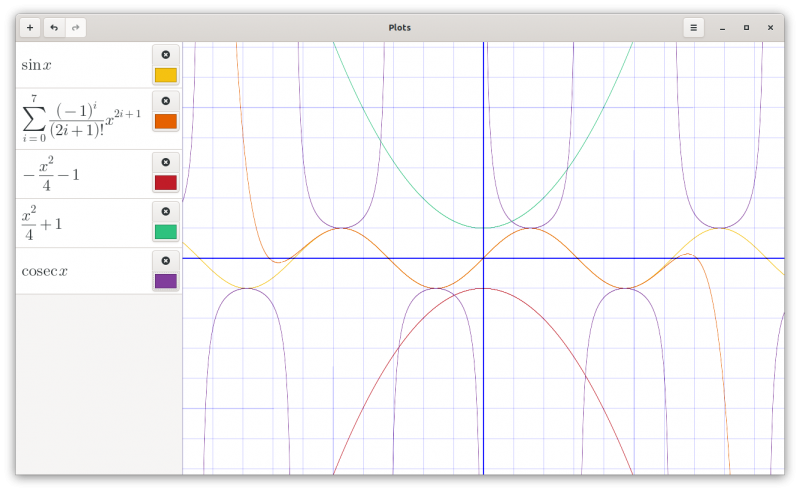
You can use multiple functions and plot them all in one graph:
I found it crashing while trying to paste some equations it could not understand. If you write something that it cannot understand or conflicts with existing equations, all plots disappear, Removing the incorrect equation brings back the plot.
No option to export the plots or copy them to clipboard unfortunately. You can always take screenshots in Linux and use the image in your document where you have to add the graphs.
Recommended Read:
Installing Plots on Linux
Plots has different installation options available for various kinds of distributions.
Ubuntu 20.04 and 20.10 users can take advantage of the PPA:
sudo add-apt-repository ppa:apandada1/plots
sudo apt update
sudo apt install plots
For other Debian based distributions, you can install it from the deb file available here.
For Arch users, Plots has been added to AUR after this article was published.
Apart from that, you can also use the Flatpak package or install it using Python.
If interested, you may check out the source code on its GitHub repository. If you like the application, please consider giving it a star on GitHub.
Conclusion
The primary use case for Plots is for students learning math or related subjects, but it can be useful in many other scenarios. I know not everyone would need that but surely helpful for the people in the academics and schools.
I would have liked the option to export the images though. Perhaps the developers can add this feature in the future releases.
Do you know any similar applications for plotting graphs? How does Plots stack up against them?