
Answer accepted by question author
Hello Tony,
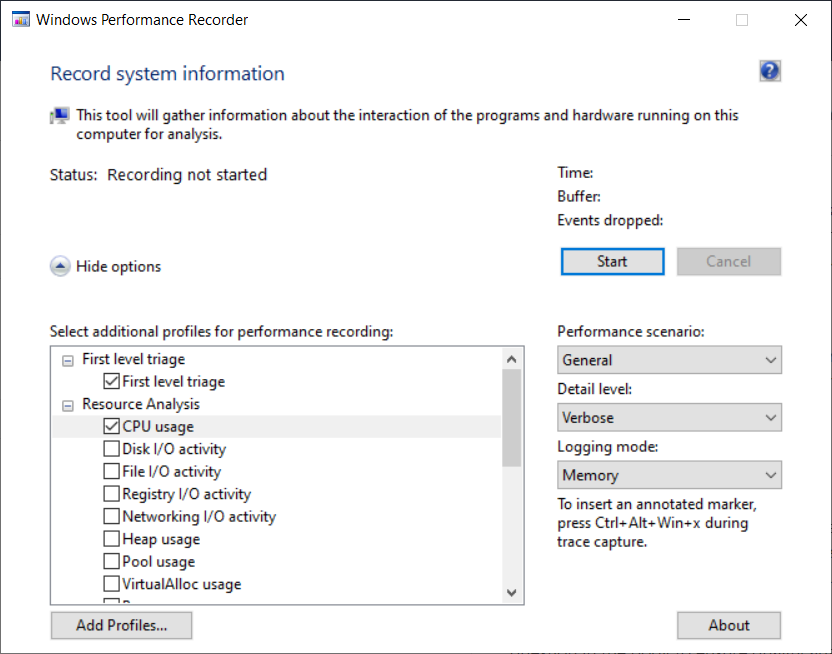
The command wpr -profiles lists the predefined profiles (the same as the list in the WPR UI) and wpr -profiledetails CPU (for example) gives an overview of what is collected by the profile. wpr -exportprofile CPU cpu.wprp exports the profile, which can then be edited.
For sample profiling, the minimum set of keywords for use with WPA is Loader, ProcessThread and SampledProfile; the minimum set of stacks is SampledProfile.
None of the EventProvider items are needed (although some might be useful if focusing on .NET or JScript code).
Starting from cpu.wprp and removing what I think is not essential gives:
<WindowsPerformanceRecorder Version="1.0">
 <Profiles>
 <SystemCollector Id="WPR_initiated_WprApp_WPR_System_Collector" Name="WPR_initiated_WprApp_WPR System Collector">
 <BufferSize Value="1024" />
 <Buffers Value="813" />
 </SystemCollector>
 <SystemProvider Id="WPR_initiated_WprApp_WPR_System_Collector_Provider">
 <Keywords>
 <Keyword Value="Loader" />
 <Keyword Value="ProcessThread" />
 <Keyword Value="SampledProfile" />
 </Keywords>
 <Stacks>
 <Stack Value="SampledProfile" />
 </Stacks>
 </SystemProvider>
 <Profile Id="CPU.Verbose.Memory" Name="CPU" Description="RunningProfile:CPU.Verbose.Memory" LoggingMode="Memory" DetailLevel="Verbose">
 <Collectors>
 <SystemCollectorId Value="WPR_initiated_WprApp_WPR_System_Collector">
 <SystemProviderId Value="WPR_initiated_WprApp_WPR_System_Collector_Provider" />
 </SystemCollectorId>
 </Collectors>
 </Profile>
 </Profiles>
</WindowsPerformanceRecorder>
If something useful seems to be missing when analysing with WPA, then just add back items that seem possibly relevant and then collect new data.
Let us know about the reliability of capturing profiling data - I am still intrigued by what you are observing.
Gary
-
Tony Grey 21 Reputation points
Hello again, Gary! And thanks for keeping this long conversation.
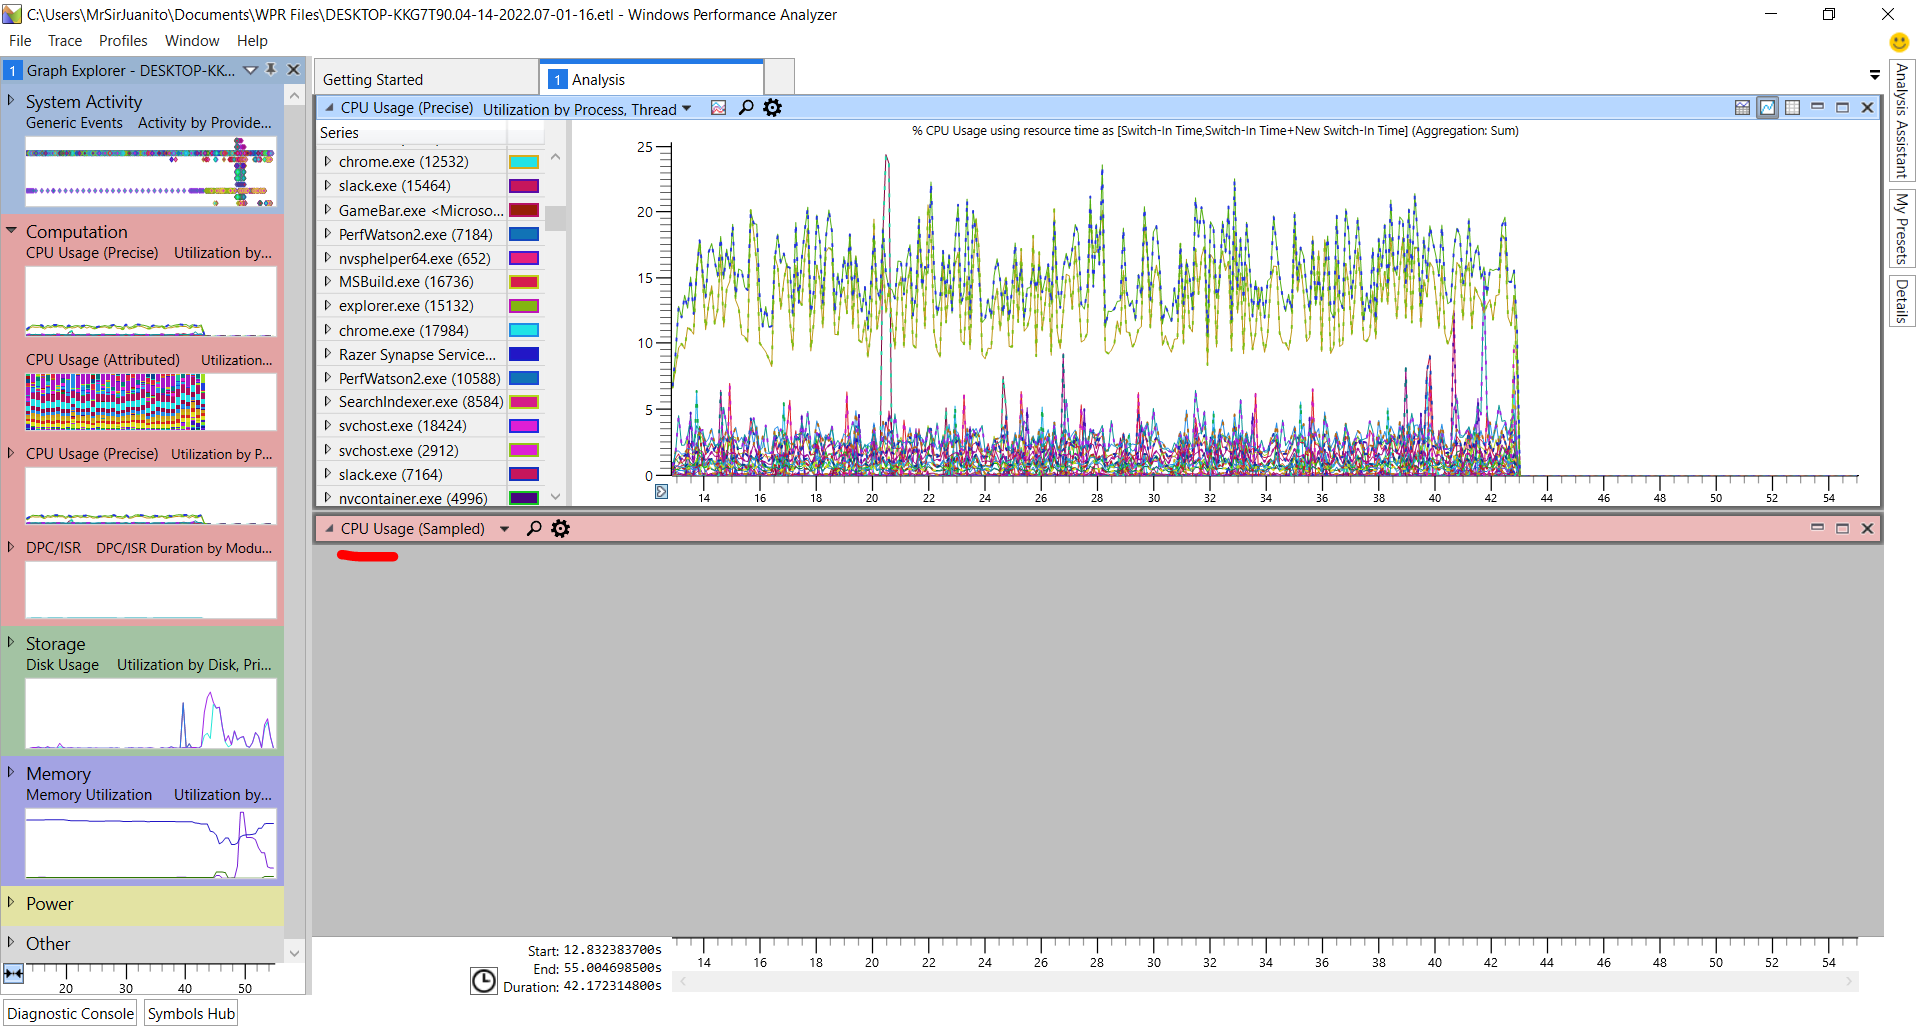
So with the profile we proposed I am able to get the CPU sampled data on every of my captures!
I'm still curious about why they weren't working before though. Can it be because the sampled data was too big to keep in the captures and was just being cut away? -
Gary Nebbett 6,476 Reputation points
Hello Tony,
From my understanding of how this all works, size itself was/is not an issue. The underlying/true cause of what you have observed is still a big (and interesting) mystery to me. There is no guarantee that you won't encounter the same symptoms again. For my own interest, I am still working on investigating what might explain the behaviour. Please keep me/us informed of any "oddities" that you notice.
Gary
-
Gary Nebbett 6,476 Reputation points
Hello Tony,
I think that this message contains the explanation for the behaviour: https://developercommunity.visualstudio.com/t/No-Data-in-CPU-Usage-Tool-Windows-Updat/1384519#T-N1447286
Essentially, a lack of coordination over use of the Performance Monitoring features of the CPU. A potential source of conflict was added as part of a Windows Defender update.
Ensuring that Windows Defender is up-to-date and reviewing the list of installed software that may potentially use performance monitoring (such as other performance tuning tools) would be reasonable steps.
Gary
-
Schutz Clark 0 Reputation points
When I ran
wpr -exportprofile CPU cpu.wprpon Administraitor CMD, it saidInvavlid option: -exportprofile. Is it no longer an option, or is there another reason? Is there another way to export a built-in profile? -
Gary Nebbett 6,476 Reputation points
Hello Schutz Clark,
The
-exportprofileoption was not available in early versions of wpr; I don't know when it was first introduced.The command
wpr -profiledetails CPUshows the essential information. It is relatively straightforward to construct a .wprp file from the output.Gary
Sign in to comment