
liip/monitor-bundle
Liip Monitor Bundle
Maintainers
Requires
- php: ^8.1
- laminas/laminas-diagnostics: ^1.27
- symfony/framework-bundle: ^6.4|^7.0|^8.0
Requires (Dev)
- doctrine/doctrine-migrations-bundle: ^2.0 || ^3.0 || ^4.0
- doctrine/migrations: ^2.0 || ^3.0 || ^4.0
- doctrine/persistence: ^1.3.3 || ^2.0 || ^3.0 || ^4.0
- enlightn/security-checker: ^1.11 || ^2.0
- guzzlehttp/guzzle: ^5.3.2 || ^6.3.3 || ^7.0.1
- matthiasnoback/symfony-dependency-injection-test: ^4.3 || ^5.0 || ^6.3
- php-cs-fixer/shim: ^3.75
- phpunit/phpunit: ^9.6.23 || ^10.5.63
- symfony/asset: ^6.4|^7.0|^8.0
- symfony/browser-kit: ^6.4|^7.0|^8.0
- symfony/expression-language: ^6.4|^7.0|^8.0
- symfony/finder: ^6.4|^7.0|^8.0
- symfony/mailer: ^6.4|^7.0|^8.0
- symfony/messenger: ^6.4|^7.0|^8.0
- symfony/phpunit-bridge: ^7.3|^8.0
- symfony/twig-bundle: ^6.4|^7.0|^8.0
- symfony/yaml: ^6.4|^7.0|^8.0
Suggests
- symfony/expression-language: To use the Expression check
Provides
None
Conflicts
None
Replaces
None
MIT 1413a0467ef1b61f49d2c462ea01c22b162ff123
- Alvaro Videla <alvaro.videla.woop@liip.ch>
- Kevin Bond
- Liip AG
- Symfony Community
This package is auto-updated.
Last update: 2026-06-24 19:16:55 UTC
README
👁 CI Status
👁 Scrutinizer Code Quality
This bundle provides a way to run a series of application related health checks. Health checks in the scope of this bundle go beyond simple actions like performing a ping to a server to see if it's alive. For example a Memcache server can be alive and not displaying any errors in your Nagios but you might not be able to access it from your PHP application. Each health check should then implement some application logic that you want to make sure always works. Another usage can be testing for specific requirements, like availability of PHP extensions.
Another design goal of the bundle was to be able to perform the checks using the same configuration and environment that your application is using. In that way you can make sure that if the health check runs successfully then your app should work too.
So each health check will be a class that will implement the CheckInterface::check
method which must return a CheckResult object. What happens inside that method
is up to the check developer.
Health checks are defined as Symfony services and they have to be tagged as
liip_monitor.check in order to be picked up by the health check runner. This gives
a lot of flexibility to application and bundle developers when they want to add their
own checks.
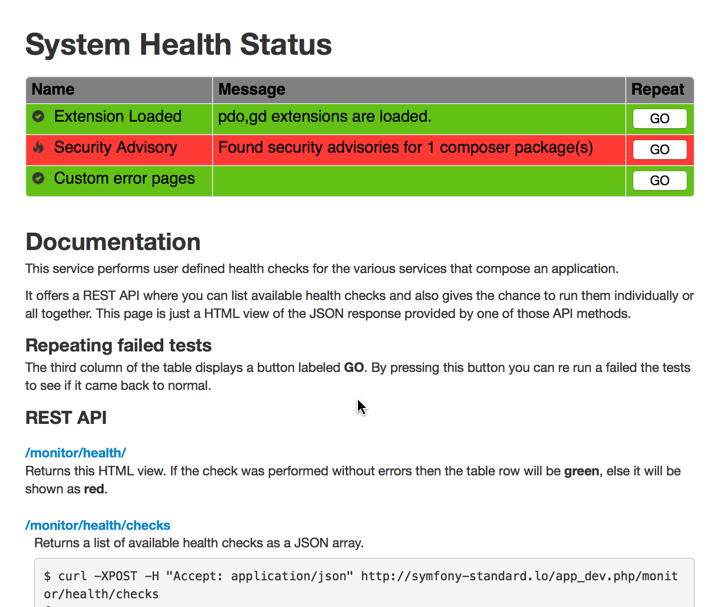
Checks are run via the command line using a Symfony command or via a REST api that delivers the results in JSON format.
Here's the web interface:
Installation
Install with composer:
composer require liip/monitor-bundle
Then register the bundle in the AppKernel.php file:
public function registerBundles()
{
 $bundles = array(
 // ...
 new Liip\MonitorBundle\LiipMonitorBundle(),
 // ...
 );

 return $bundles;
}
If you want to enable the REST API provided by the bundle then add the following to your routing.yml:
_monitor:
 resource: "@LiipMonitorBundle/Resources/config/routing.yaml"
 prefix: /monitor/health
Then, enable the controller in your configuration:
liip_monitor:
 enable_controller: true
And finally don't forget to install the bundle assets into your web root:
./app/console assets:install web --symlink --relative
Enabling built-in health checks
To enable built-in health checks, add them to your config.yml
liip_monitor:
 checks:
 php_extensions: [apc, xdebug]
Adding Health Checks
See Writing Custom Checks for instructions on creating a custom check.
Once you implemented the class then it's time to register the check service with our service container:
services:
 monitor.check.php_extensions:
 class: Acme\HelloBundle\Check\PhpExtensionsCheck
 arguments:
 - [ xhprof, apc, memcache ]
 tags:
 - { name: liip_monitor.check, alias: php_extensions }
The important bit there is to remember to tag your services with the liip_monitor.check tag.
By doing that the check runner will be able to find your checks. Keep in mind that checks
can reside either in your bundles or in your app specific code. The location doesn't matter
as long as the service is properly tagged. The alias is optional and will then simply
define the id used when running health checks individually, otherwise the full service
id must be used in this case.
If your app's service definition is using autoconfigure to discover services then classes
which implement Laminas\Diagnostics\Check\CheckInterface will be tagged automatically.
Available Built-in Health Checks
See "Full Default Config" below for a list of all built-in checks and their configuration.
Running Checks
There are two ways of running the health checks: by using the CLI or by using the REST API provided by the bundle. Let's see what commands we have available for the CLI:
List Checks
$ ./app/console monitor:list

monitor.check.jackrabbit
monitor.check.redis
monitor.check.memcache
monitor.check.php_extensions
Run All the Checks
$ ./app/console monitor:health

Jackrabbit Health Check: OK
Redis Health Check: OK
Memcache Health Check: KO - No configuration set for session.save_path
PHP Extensions Health Check: OK
Run Individual Checks
To run an individual check you need to provide the check id to the health command:
$ ./app/console monitor:health monitor.check.php_extensions

PHP Extensions Health Check: OK
Run health checks as composer post-install/update scripts
To run health checks as a composer post-install or post-update script, simply add the
Liip\\MonitorBundle\\Composer\\ScriptHandler::checkHealth ScriptHandler to the
post-install-cmd / post-update-cmd command sections of your composer.json:
"scripts": {
 "post-install-cmd": [
 "Sensio\\Bundle\\DistributionBundle\\Composer\\ScriptHandler::buildBootstrap",
 "Sensio\\Bundle\\DistributionBundle\\Composer\\ScriptHandler::clearCache",
 "Sensio\\Bundle\\DistributionBundle\\Composer\\ScriptHandler::installAssets",
 "Sensio\\Bundle\\DistributionBundle\\Composer\\ScriptHandler::installRequirementsFile",
 "Liip\\MonitorBundle\\Composer\\ScriptHandler::checkHealth"
 ],
 "post-update-cmd": [
 "Sensio\\Bundle\\DistributionBundle\\Composer\\ScriptHandler::buildBootstrap",
 "Sensio\\Bundle\\DistributionBundle\\Composer\\ScriptHandler::clearCache",
 "Sensio\\Bundle\\DistributionBundle\\Composer\\ScriptHandler::installAssets",
 "Sensio\\Bundle\\DistributionBundle\\Composer\\ScriptHandler::installRequirementsFile",
 "Liip\\MonitorBundle\\Composer\\ScriptHandler::checkHealth"
 ]
},
Adding Additional Reporters
There are two default reporters: ArrayReporter for the REST API and ConsoleReporter for the CLI command. You can
add additional reporters to be used by either of these.
First, define an additional reporter service and tag it with liip_monitor.additional_reporter:
my_reporter:
 class: My\Reporter
 tags:
 - { name: liip_monitor.additional_reporter, alias: my_reporter }
To run additional reporters with the CLI, add --reporter=... options for each one:
./app/console monitor:health --reporter=my_reporter
To run this reporter with the REST API, add a reporters query parameter:
/monitor/health?reporters[]=my_reporter
You can list available reporters with:
bin/console monitor:list --reporters
Grouping Checks
It is possible to group the health checks for different environments (e.g. application server, cron runner, ...).
If not specified differently, all health checks belong to the default group.
Define groups for build-in checks
To define groups for built-in health checks, add the following grouping hint to your config.yml:
liip_monitor:
 default_group: default
 checks:
 groups:
 default: # checks you may want to execute by default
 php_extensions: [apc, xdebug]
 cron: # checks you may want to execute only on cron servers
 php_extensions: [redis]
This creates two groups, default and cron, each having different checks.
Define groups for tagged Services
To define groups for tagged services, add a group attribute to the respective tags:
services:
 monitor.check.php_extensions:
 class: Acme\HelloBundle\Check\PhpExtensionsCheck
 arguments:
 - [ xhprof, apc, memcache ]
 tags:
 - { name: liip_monitor.check, alias: php_extensions, group: cron }
 - { name: liip_monitor.check, alias: php_extensions, group: app_server }
autoconfigure will place checks into the default group. You must add autoconfigure: false to the service
definition to change the group:
services:
 Acme\HelloBundle\Check\PhpExtensionsCheck:
 autoconfigure: false
 tags:
 - { name: liip_monitor.check, group: app_server }
Specify group for CLI commands
Both CLI commands have a --group=... option. If it is not given, the default group is used.
bin/console monitor:list --group=app_server
bin/console monitor:health --group=app_server
Both commands, monitor:list and monitor:health, have an option --all to list or run the checks of all registered
groups. Additionally, the monitor:list has an option --groups to list all registered groups.
Full Default Config
liip_monitor:
 enable_controller: false
 view_template: null
 failure_status_code: 502
 mailer:
 enabled: false
 recipient: ~ # Required
 sender: ~ # Required
 subject: ~ # Required
 send_on_warning: true
 default_group: default
 checks:

 # Grouping checks
 groups:

 # Prototype
 name:

 # Validate that a named extension or a collection of extensions is available
 php_extensions: [] # Example: apc, xdebug

 # Pairs of a PHP setting and an expected value
 php_flags: # Example: session.use_only_cookies: false

 # Prototype
 setting: ~

 # Pairs of a version and a comparison operator
 php_version: # Example: 5.4.15: >=

 # Prototype
 version: ~

 # Process name/pid or an array of process names/pids
 process_running: ~ # Example: [apache, foo]

 # Validate that a given path (or a collection of paths) is a dir and is readable
 readable_directory: [] # Example: ["%kernel.cache_dir%"]

 # Validate that a given path (or a collection of paths) is a dir and is writable
 writable_directory: [] # Example: ["%kernel.cache_dir%"]

 # Validate that a class or a collection of classes is available
 class_exists: [] # Example: ["Lua", "My\Fancy\Class"]

 # Benchmark CPU performance and return failure if it is below the given ratio
 cpu_performance: ~ # Example: 1.0 # This is the power of an EC2 micro instance

 # Checks to see if the disk usage is below warning/critical percent thresholds
 disk_usage:
 warning: 70
 critical: 90
 path: '%kernel.cache_dir%'

 # Checks Symfony2 requirements file
 symfony_requirements:
 file: '%kernel.root_dir%/SymfonyRequirements.php'

 # Checks to see if the OpCache memory usage is below warning/critical thresholds
 opcache_memory:
 warning: 70
 critical: 90

 # Checks to see if the APC memory usage is below warning/critical thresholds
 apc_memory:
 warning: 70
 critical: 90

 # Checks to see if the APC fragmentation is below warning/critical thresholds
 apc_fragmentation:
 warning: 70
 critical: 90

 # Connection name or an array of connection names
 doctrine_dbal: null # Example: [default, crm]

 # Checks to see if migrations from specified configuration file are applied
 doctrine_migrations:
 # Examples:
 application_migrations:
 configuration_file: %kernel.root_dir%/Resources/config/migrations.yml
 connection: default
 migrations_with_doctrine_bundle:
 connection: default
 migrations_with_doctrine_bundle_v2: default

 # Prototype
 name:
 # Absolute path to doctrine migrations configuration
 configuration_file: ~
 # Connection name from doctrine DBAL configuration
 connection: ~ # Required

 # Connection name or an array of connection names
 doctrine_mongodb: null # Example: [default, crm]

 # Check if MemCache extension is loaded and given server is reachable
 memcache:

 # Prototype
 name:
 host: localhost
 port: 11211

 # Validate that a Redis service is running
 redis:

 # Prototype
 name:
 host: localhost
 port: 6379
 password: null
 # or
 dsn: redis://localhost:6379

 # Attempt connection to given HTTP host and (optionally) check status code and page content
 http_service:

 # Prototype
 name:
 host: localhost
 port: 80
 path: /
 status_code: 200
 content: null

 # Attempt connection using Guzzle to given HTTP host and (optionally) check status code and page content
 guzzle_http_service:

 # Prototype
 name:
 url: localhost
 headers: []
 options: []
 status_code: 200
 content: null
 method: GET
 body: null

 # Validate that a RabbitMQ service is running
 rabbit_mq:

 # Prototype
 name:
 host: localhost
 port: 5672
 user: guest
 password: guest
 vhost: /
 # or
 dsn: amqp://guest:guest@localhost:5672/%2F

 # Checks the version of this app against the latest stable release
 symfony_version: ~

 # Checks if error pages have been customized for given error codes
 custom_error_pages:
 # The status codes that should be customized
 error_codes: [] # Required

 # The directory where your custom error page twig templates are located. Keep as "%kernel.project_dir%" to use default location.
 path: '%kernel.project_dir%'

 # Checks installed composer dependencies against the SensioLabs Security Advisory database
 security_advisory:
 lock_file: '%kernel.root_dir%/../composer.lock'

 # Validate that a stream wrapper or collection of stream wrappers exists
 stream_wrapper_exists: [] # Example: ['zlib', 'bzip2', 'zip']

 # Find and validate INI files
 file_ini: [] # Example: ['path/to/my.ini']

 # Find and validate JSON files
 file_json: [] # Example: ['path/to/my.json']

 # Find and validate XML files
 file_xml: [] # Example: ['path/to/my.xml']

 # Find and validate YAML files
 file_yaml: [] # Example: ['path/to/my.yml']

 # PDO connections to check for connection
 pdo_connections:

 # Prototype
 name:
 dsn: null
 username: null
 password: null
 timeout: 1

 # Checks that fail/warn when given expression is false (expressions are evaluated with symfony/expression-language)
 expressions:

 # Example:
 opcache:
 label: OPcache
 warning_expression: ini('opcache.revalidate_freq') > 0
 critical_expression: ini('opcache.enable')
 warning_message: OPcache not optimized for production
 critical_message: OPcache not enabled

 # Prototype
 alias:
 label: ~ # Required
 warning_expression: null # Example: ini('apc.stat') == 0
 critical_expression: null # Example: ini('short_open_tag') == 1
 warning_message: null
 critical_message: null

 # Validate that a messenger transport does not contain more than warning/critical messages
 # Transport must implement MessageCountAwareInterface
 messenger_transports:
 name: # name of transport
 critical_threshold: 10 # required
 warning_threshold: null # optional: warning level
 service: null # defaults to messenger.transport.name
REST API DOCS
For documentation on the REST API see: http://myproject.org/monitor/health/.
Don't forget to add the bundle routes in your routing.yaml file.
Nagios integration
You can find a simple Nagios check written in Perl and Python in the Resources/scripts directory.
Perl Version
This is dependent on perl modules available on CPAN Getopt::Std, WWW::Mechanize, and JSON
Copy the script into your scripts directory in Nagios and create a command like this:
define command{
 command_name check_symfony_health
 command_line $USER1$/check_symfony2.pl -H $HOSTNAME$
}
Running the command with the Hostname flag (-H) will check "http://$HOSTNAME$/monitor/health/run". You can also use the Address flag (-A) to check a specified URL:
command_line $USER1$/check_symfony2.pl -A https://mysite.org/monitor/health/run
The plugin can be used with Authentication, Using the Username (-u) and Password (-p) flags:
command_line $USER1$/check_symfony2.p1 -H $HOSTNAME$ -u username -p password
You can also specify the Warning (-w) and Critical (-c) levels for the check using the standard flags
command_line $USER1$/check_symfony2.pl -H $HOSTNAME$ -w 1 -c 2
Any flags can be combined except -A and -H. THe -u and -p flags should always be used together.
Python Version
The Python version depends on the nagiosplugin library < 1.0.0.
Copy the script into your scripts directory in Nagios and create a command like this:
define command{
 command_name check_symfony_health
 command_line $USER1$/check_symfony2.py -w 0 -c 0 -u https://$HOSTNAME$
}
To use the plugin with HTTP basic authentication, change the command to:
command_line $USER1$/check_symfony2.py -w 0 -c 0 -u https://$HOSTNAME$ -a username:password
Connecting Check to Host in Nagios
Add a service:
define service{
 hostgroup_name Symfony2
 service_description Symfony2 health check
 check_command check_symfony_health
 use generic-service
}
And create a host attached to the Symfony2 hostgroup:
define host{
 use web-host
 host_name www.myhost.com
 address 8.8.8.4
 hostgroups Symfony2
}
And place your host within the Symfony2 hostgroup.