
Display options
Format
No abstract available
Figures
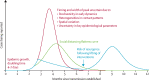
Illustrative simulations of a transmission model of COVID-19 A baseline simulation with case isolation only (red); a simulation with social distancing in place throughout the epidemic, flattening the curve (green), and a simulation with more effective social distancing in place for a limited period only, typically followed by a resurgent epidemic when social distancing is halted (blue). These are not quantitative predictions but robust qualitative illustrations for a range of model choices.
References
-
- WHO Coronavirus disease 2019 (COVID-19) situation report—44. March 4, 2020. https://www.who.int/docs/default-source/coronaviruse/situation-reports/2... (accessed March 5, 2020).
-
- Imperial College London, MRC Centre for Global Infectious Disease Analysis News / COVID-19—report 3: transmissibility of 2019-nCoV. 2020. Feb 21, 2010. https://www.imperial.ac.uk/mrc-global-infectious-disease-analysis/news–w... (accessed March 5, 2020).
-
- WHO Coronavirus disease (COVID-2019) situation report—30. https://www.who.int/docs/default-source/coronaviruse/situation-reports/2... (accessed March 5, 2020).
MeSH terms
Grants and funding
LinkOut - more resources
Full Text Sources
Other Literature Sources
Medical