
More than 5 years have passed since last update.
Xcode 6です。
ファイル作成
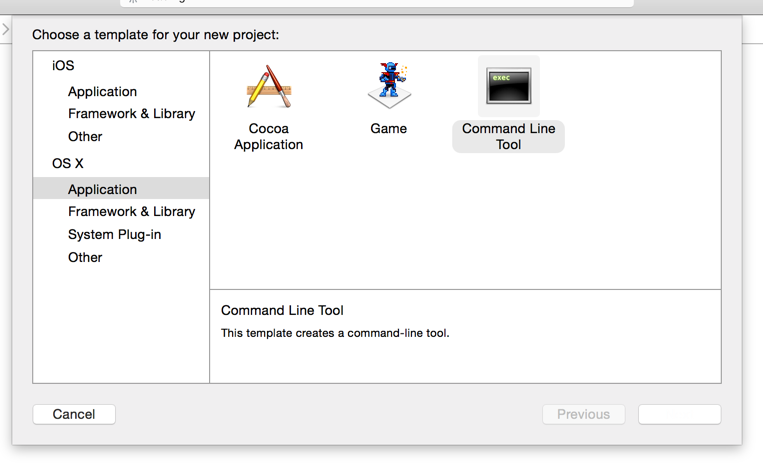
新規プロジェクト作成でCommand Line Toolを選びます。
👁 Screenshot_8_7_15__11_35_PM.png
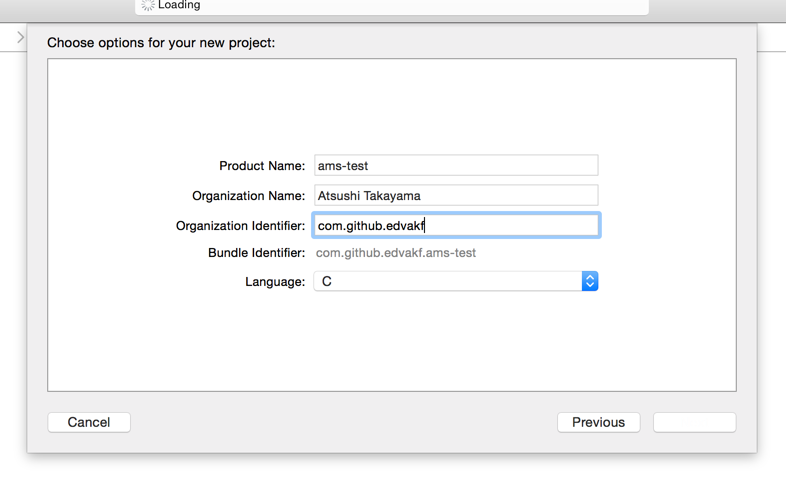
言語はCを選ぶ。
👁 Screenshot_8_7_15__11_37_PM.png
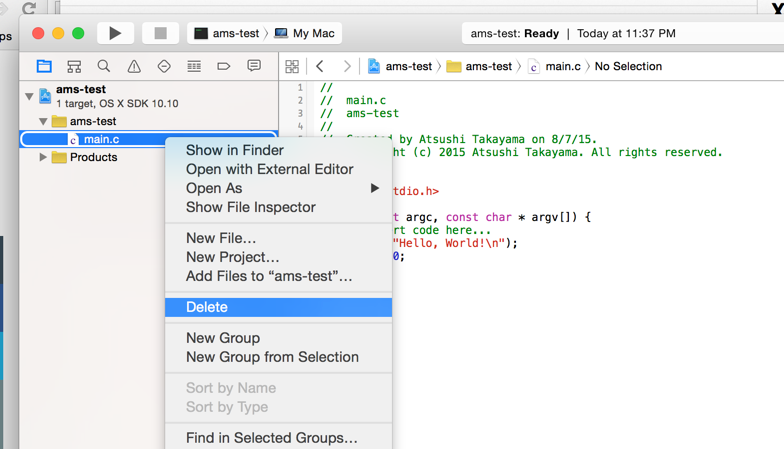
main.cは消しちゃいます。
👁 Project_navigator_contextual_menu_and_main_c_and_NSDictionary_URLEncoding_swift.png
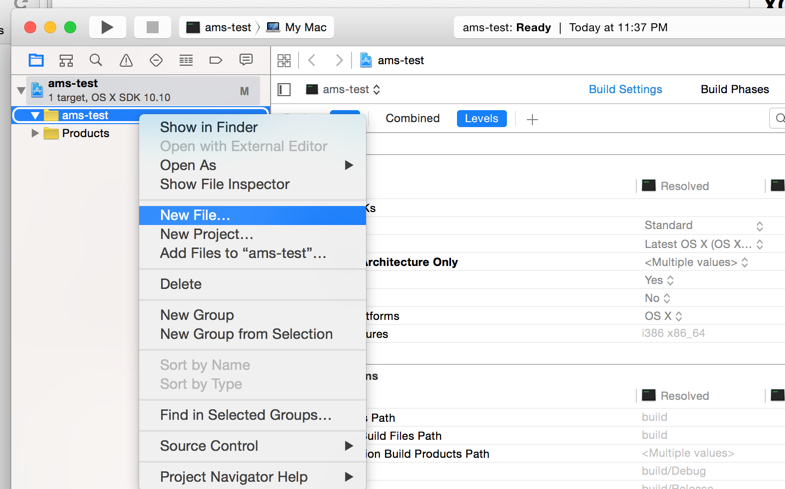
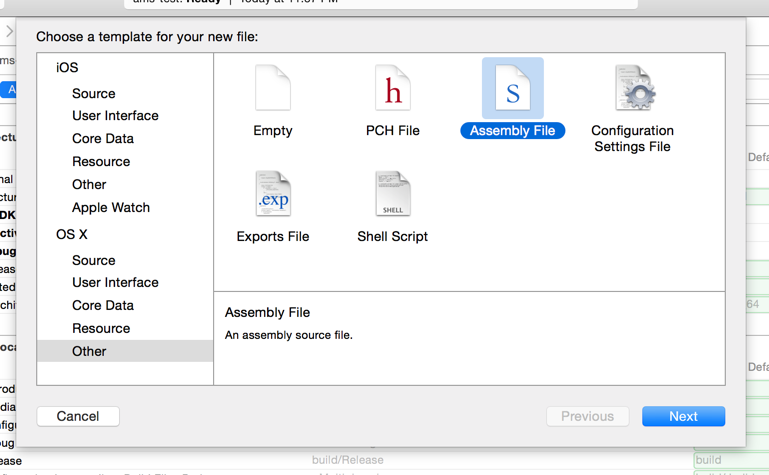
新規ファイル作成から、
👁 Project_navigator_contextual_menu_and_ams-test_xcodeproj_and_NSDictionary_URLEncoding_swift.png
Assembly Fileを選びます。
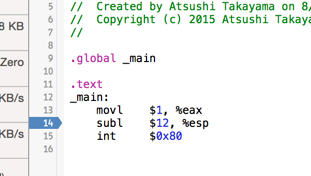
こういうコードを書きます。
.global _main

.text
_main:
 movl $1, %eax
 subl $12, %esp
 int $0x80
たぶんgasのAT&Tシンタックスというやつだと思います。(自信ない)
Intelシンタックス
Intelシンタックスを使うには .intel_syntax noprefix をつけます。
.intel_syntax noprefix

.global _main

.text
_main:
 mov eax, 1
 sub esp, 12
 int 0x80
ビルド
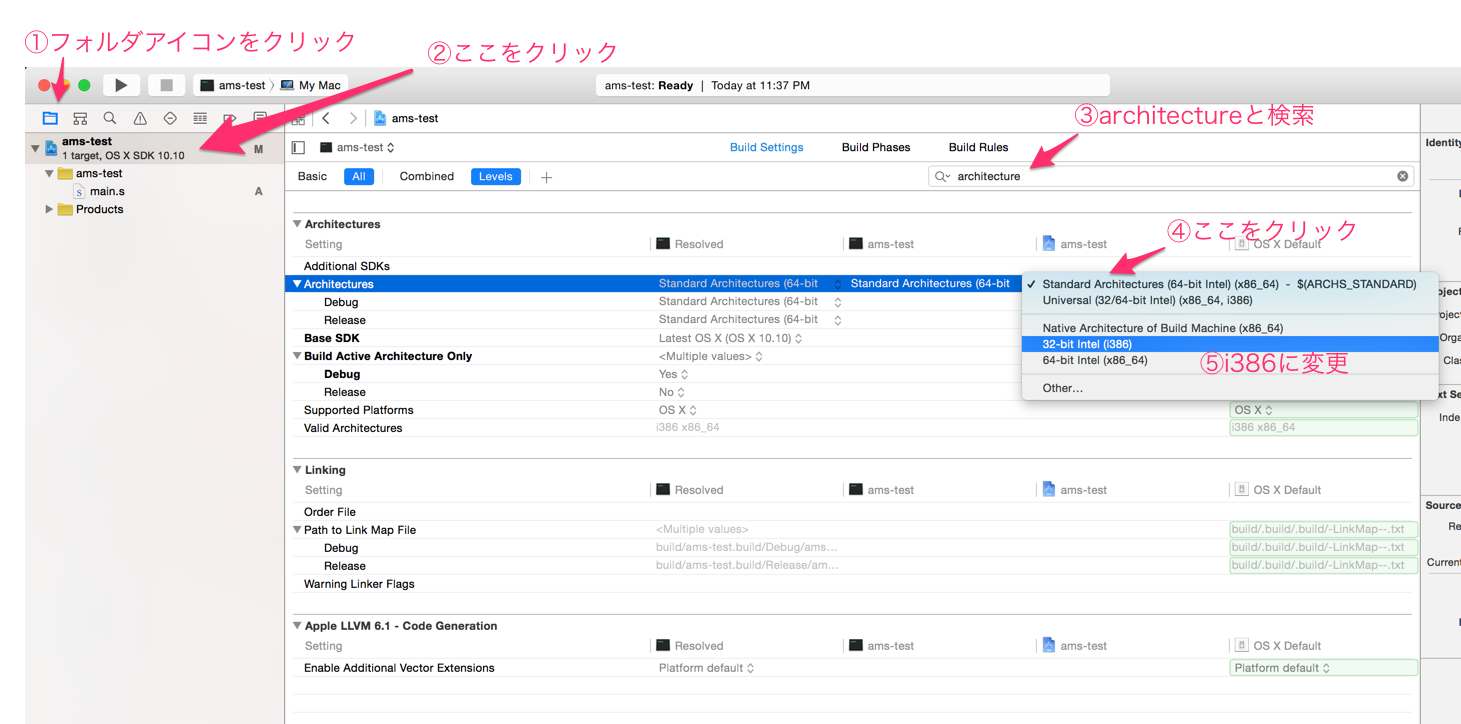
このままだと64bitでコンパイルされると思うので、32bitでコンパイルされるようにします。
ビルドしてできるファイルを file コマンドで見てみると、x86_64からi386に変わっているのがわかります。
% file ams-test: Mach-O 64-bit executable x86_64
% file ams-test: Mach-O executable i386
デバッグ
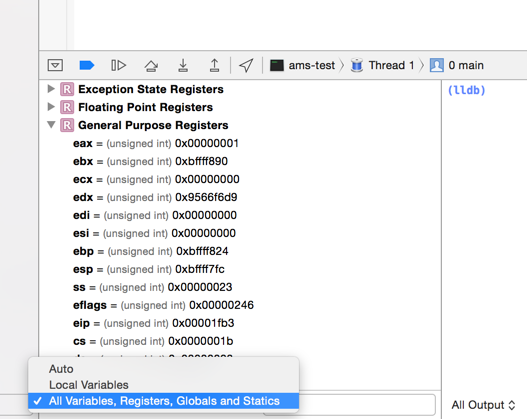
ブレークポイントも置けます。
デバッガーのパネルではAll Variables, Registers, Globals and Statisticsを選択しておくとレジスタの値が見られます。
👁 OtherViews_and_main_s_—_Edited.png
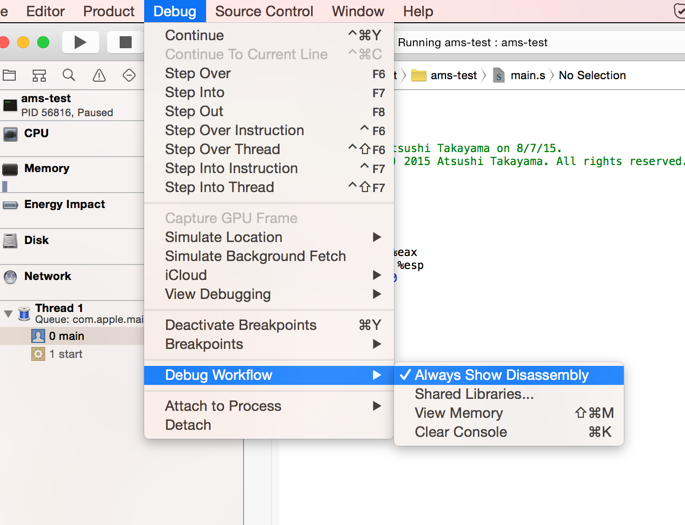
それから、Debug→Debug Workflow→Always Show Disassemblyにチェックを入れておくと、
👁 Debug_Workflow_and_Debug.png
ブレークポイントで止まるときにこういうのが出てきます。
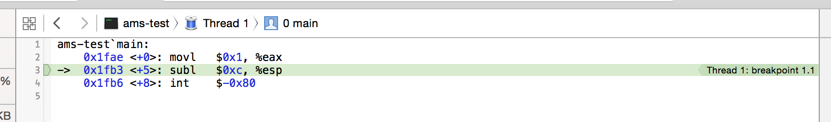
ここはソースコードをintelシンタックスで書いたとしてもAT&Tシンタックスで表示されます。
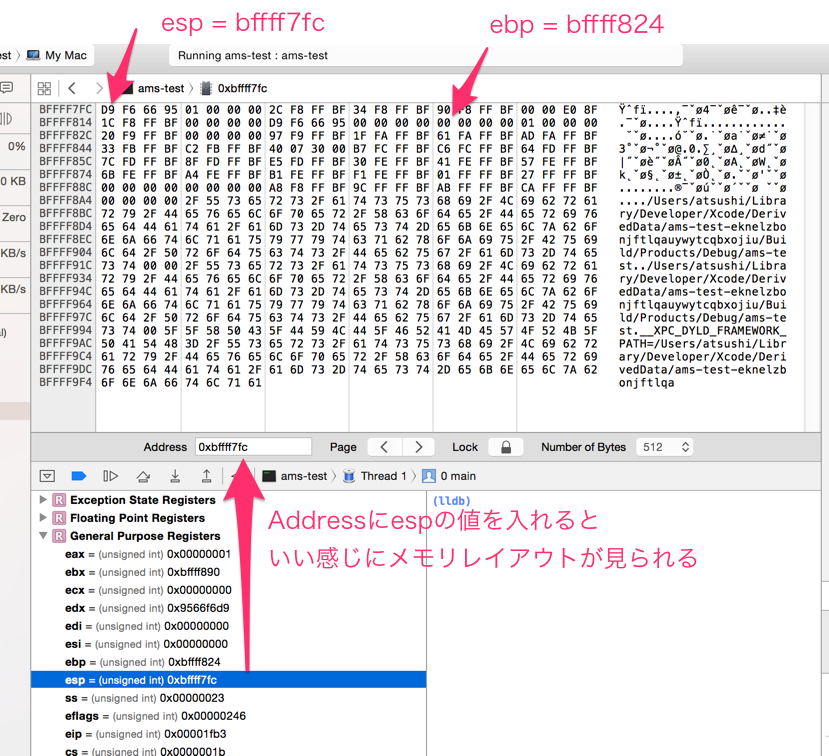
また、そのすぐ下のView Memoryを選ぶとこういう画面が出てきます。
Addressというところに例えばespレジスタ周辺の値を入れると、スタックのメモリレイアウトが見られます。
Register as a new user and use Qiita more conveniently
- You get articles that match your needs
- You can efficiently read back useful information
- You can use dark theme