
More than 5 years have passed since last update.
散布図のProjection色々
Projectionパラメータを色々試してみます。
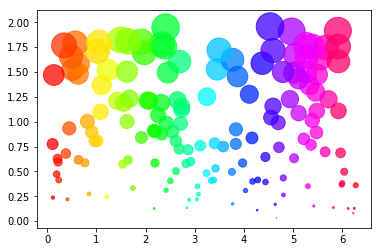
基本
import numpy as np
import matplotlib.pyplot as plt

np.random.seed(20190805)

N = 150
r = 2 * np.random.rand(N)
theta = 2 * np.pi * np.random.rand(N)
area = 200 * r**2
colors = theta

fig = plt.figure()
ax = fig.add_subplot(111)
c = ax.scatter(theta, r, c=colors, s=area, cmap='hsv', alpha=0.75)
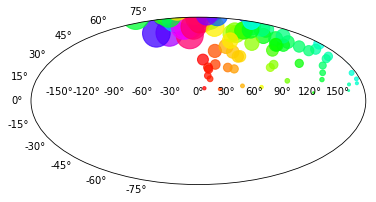
aitoff
ax = fig.add_subplot(111, projection='aitoff')
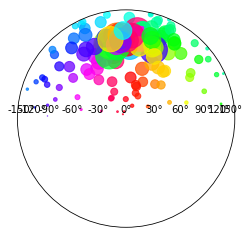
lambert
ax = fig.add_subplot(111, projection='lambert')
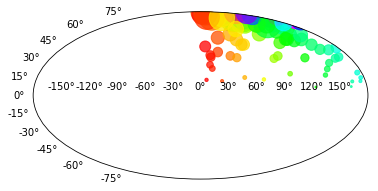
mollweide
ax = fig.add_subplot(111, projection='mollweide')
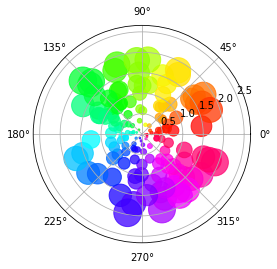
polar
ax = fig.add_subplot(111, projection='polar')
Register as a new user and use Qiita more conveniently
- You get articles that match your needs
- You can efficiently read back useful information
- You can use dark theme