
More than 1 year has passed since last update.
はじめに
散布図は、2つの変数の相関関係を表現する方法です。
ごく基本的な図で、度数分布図や箱ひげ図などと並んで良く使われる手法だと思いますが、今回はその作図方法をまとめてみました。
解析に使うデータ
- 以下のデータは、ある山の東側(east)と西側(west)の様々な標高で測定した樹高(m)です。
- direction列:斜面の方角(east/west)
- altitude列:測定地点の標高
- tree_height列:測定された樹高
tree_height.csv
direction,altitude,tree_height
east,260,12.1
east,320,12.3
east,390,8.2
east,430,9.8
east,470,7.9
east,500,6
west,280,15.3
west,330,11.9
west,380,11.2
west,410,9.3
west,440,7.9
west,500,6.8
データの読み込み
- setwd関数でCSVファイルの置かれたディレクトリに移動してから、CSVファイルを相対パスで読み込んでいます。
- read.table関数に指定するパスは、絶対パスでも動作します。
Rのコンソール
setwd("C:\\")tree_height<-read.table(".\\tree_height.csv",header=TRUE,encoding="CP932",sep=",")tree_heightdirectionaltitudetree_height1east26012.12east32012.33east3908.24east4309.85east4707.96east5006.07west28015.38west33011.99west38011.210west4109.311west4407.912west5006.8単純な散布図の描画
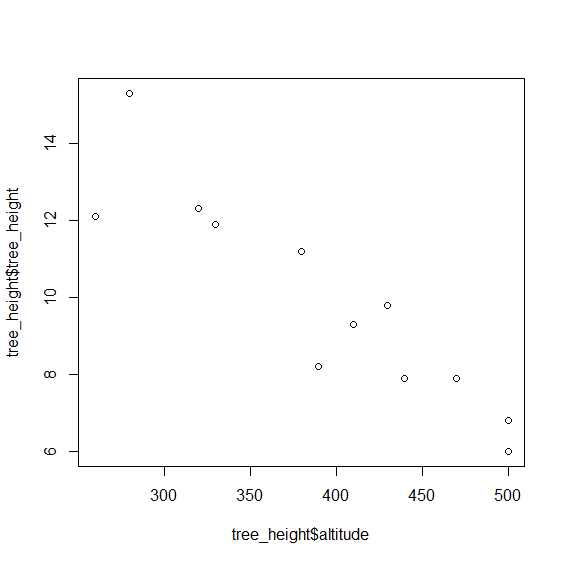
- plot(横軸のデータ, 縦軸のデータ)とすることで、簡単に散布図を作成できます。
- 明示的に散布図を指定する場合はplot関数に
type="p"というパラメーターを指定しますが、plot関数はデフォルト値なので特に指定する必要はありません。 - 散布図として表現すると、「標高が上がるにつれて、樹高が低くなっている」ということが一目で分かります。
Rのコンソール
plot(tree_height$altitude,tree_height$tree_height)
散布図のタイトルと軸のラベルを指定する
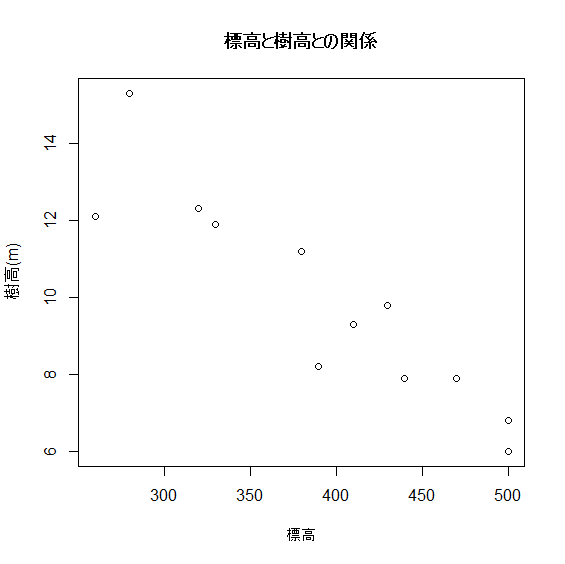
- 以下のようにパラメーターを追加することで、タイトルと軸のラベルを指定して散布図を描画することができます。
- main:グラフのタイトル
- xlab:横軸のラベル
- ylab:縦軸のラベル
Rのコンソール
plot(tree_height$altitude,tree_height$tree_height,main="標高と樹高との関係",xlab="標高(m)",ylab="樹高(m)")
グループごとに異なるマーカーで散布図を描画する
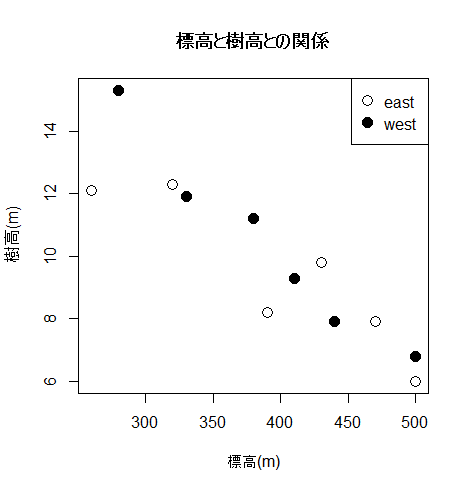
- 「東斜面のデータを白丸(〇)、西斜面のデータを黒丸(●)」というように、データのグループごとに異なるマーカーで表現する時は、以下のように「最初は散布図の枠だけ作っておく」というのがポイントです。
- 最後に凡例を表示させる必要がありますが、凡例は散布図の描画範囲(枠内)だけでなく、その外側に表示させることもできるようです。
- 外側に表示させるのは、実際にやったことがないので分かりません...
- 記号(○と●)のサイズを1.5倍にして、図を見やすくしました。
Rのコンソール
# type="n"を指定して、散布図の「枠」だけを作成するplot(tree_height$altitude,tree_height$tree_height,main="標高と樹高との関係",xlab="標高(m)",ylab="樹高(m)",type="n")# 東斜面のデータを白丸(〇)で描画するpoints(tree_height$altitude[tree_height$direction=="east"],tree_height$tree_height[tree_height$direction=="east"],pch=1,cex=1.5)# 西斜面のデータを黒丸(●)で描画するpoints(tree_height$altitude[tree_height$direction=="west"],tree_height$tree_height[tree_height$direction=="west"],pch=16,cex=1.5)# 散布図の右上に凡例を表示する。# 文字サイズは通常(cex = 1)で、記号のサイズは1.5倍(pt.cex = 1.5)に設定legend("topright",pch=c(1,16),cex=1,pt.cex=1.5,legend=c("east","west"))
参考URL
Register as a new user and use Qiita more conveniently
- You get articles that match your needs
- You can efficiently read back useful information
- You can use dark theme