
Global Maps
NASA satellites give us a global view of what’s happening on our planet. Explore how key parts of Earth’s climate system change from month to month.
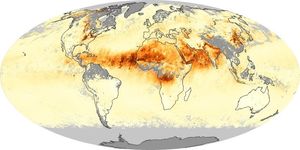
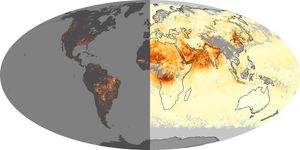
Airborne aerosols can cause or prevent cloud formation and harm human health. These maps depict aerosol concentrations in the air…
Sea salt, volcanic ash, dust, wildfire smoke, and industrial pollution are types of airborne aerosols. Natural aerosols tend to be…
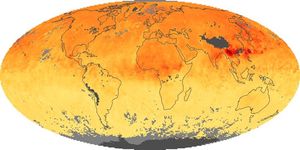
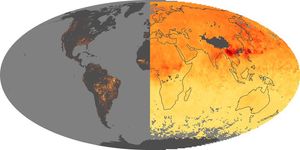
When fuels such as coal, wood, and oil burn incompletely, they produce carbon monoxide. The gas is spread by winds…
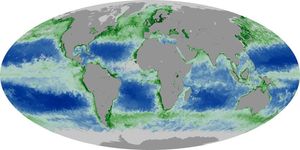
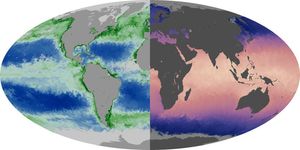
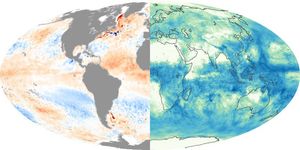
Chlorophyll is used by algae and other phytoplankton--the grass of the sea--to convert sunlight and carbon dioxide into sugars. These…
At the base of the ocean food web are single-celled algae and other plant-like organisms known as phytoplankton. Like plants…
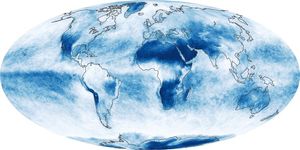
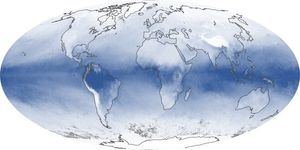
In addition to making rain and snow, clouds can have a warming or cooling influence depending on their altitude, type,…
The Earth’s land surfaces, life, oceans, and atmosphere endlessly recycle the planet’s water. Liquid water on the surface is transformed…
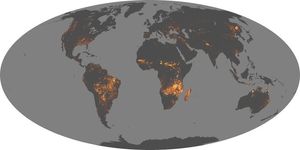
Whether started by humans (farming, logging, or accidents) or by nature (lightning), fires are always burning somewhere on Earth. These…
In addition to gases and clouds, Earth’s atmosphere contains tiny liquid and solid particles called aerosols. Aerosols influence air quality…
On Earth, something is always burning: wildfires started by lightning or people, controlled agricultural fires, or fossil fuels. When anything…
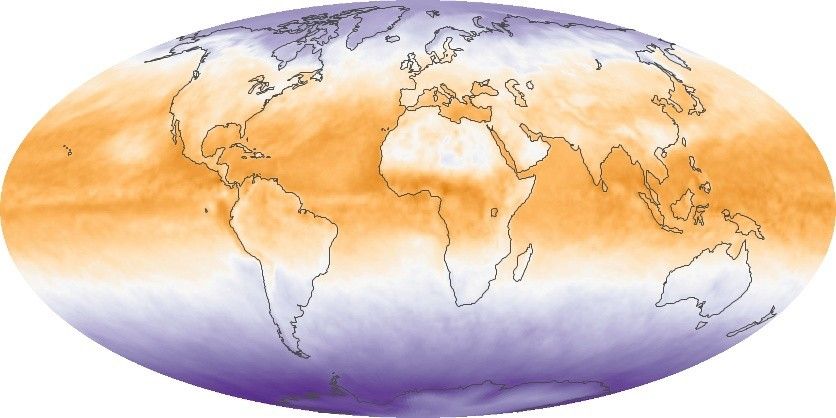
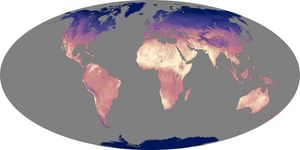
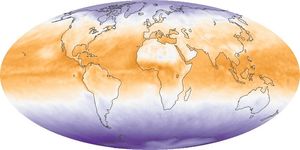
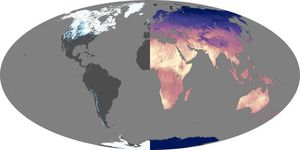
Land surface temperatures rise and fall with the heat of the Sun, and they represent how hot or cold the…
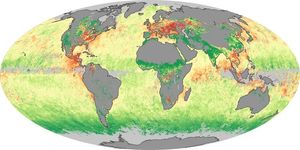
Temperature is one of the three major influences on global patterns of plant growth. Along with available sunlight and water,…
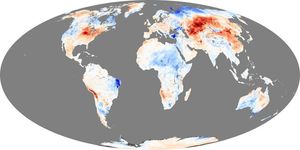
These maps depict anomalies in land surface temperatures (LSTs); that is, how much hotter or cooler a region was compared…
Net radiation is the balance between incoming and outgoing energy at the top of the atmosphere. It is the total…
Earth’s climate, including its average surface temperature, depends on the balance between incoming and outgoing energy. Energy comes in to…
Earth’s climate, including its average surface temperature, depends on the balance between incoming and outgoing energy. Energy comes in to…
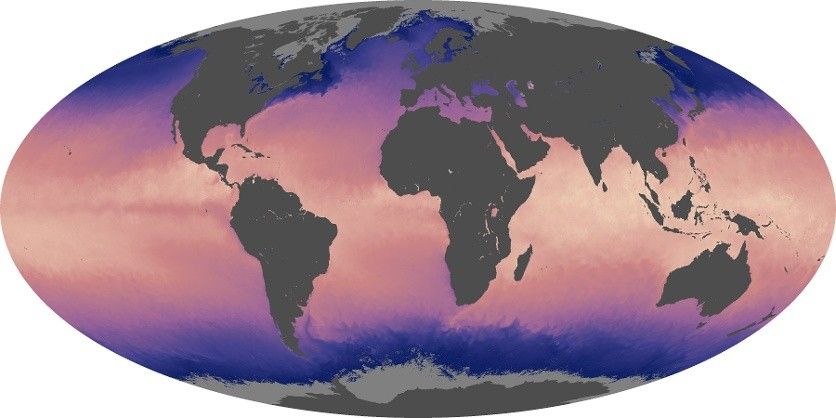
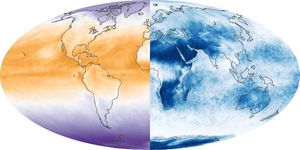
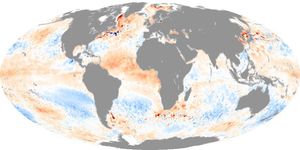
Ocean temperatures can influence weather, such as hurricane formation, and climate patterns, such as El Niño. These maps show the…
Sea surface temperatures have a large influence on climate and weather. Even changes of just a few degrees Celsius can…
These maps depict how much hotter or cooler an ocean basin was compared to the long-term average. Temperature anomalies can…
The atmosphere and the ocean are intimately connected. Ocean temperatures influence rainfall patterns throughout the world, so when ocean temperatures…
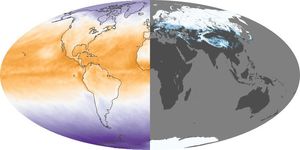
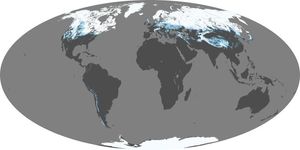
Snow and ice influence climate by reflecting sunlight back into space. When it melts, snow is a source of water…
Snow cover and land surface temperature influence each other. Snow influences how hot or cold the land feels to the…
These maps depict monthly total rainfall around the world. Rainfall is the primary source of fresh water for humans, plants,…
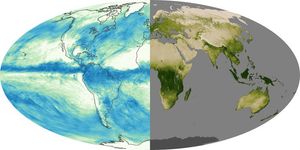
One of the most important ingredients for plant growth is water. In many ecosystems, particularly grasslands and cropland, seasonal plant…
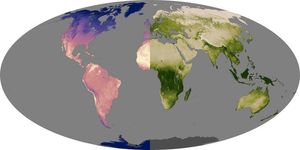
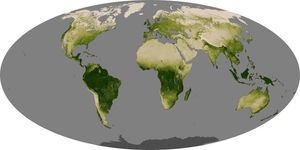
Greenness is an important indicator of health for forests, grasslands, and farms. The greenness of a landscape, or vegetation index,…
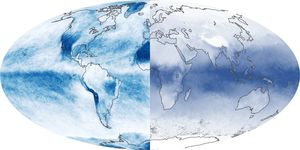
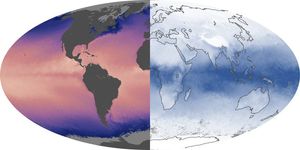
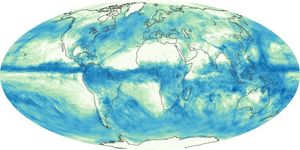
These maps show the average amount of water vapor in a column of atmosphere by month. Water vapor is the…
Discover More from NASA Earth Science
Subscribe to Earth Observatory Newsletters
Subscribe to the Earth Observatory and get the Earth in your inbox.
Earth Observatory Image of the Day
NASA's Earth Observatory brings you the Earth, every day, with in-depth stories and stunning imagery.
Explore Earth Science
Earth Science Data
Open access to NASA’s archive of Earth science data