 |
VOOZH | about |
|
VOOZH | about |
Troubleshooting application problems is easy when you can correlate all of your data together!
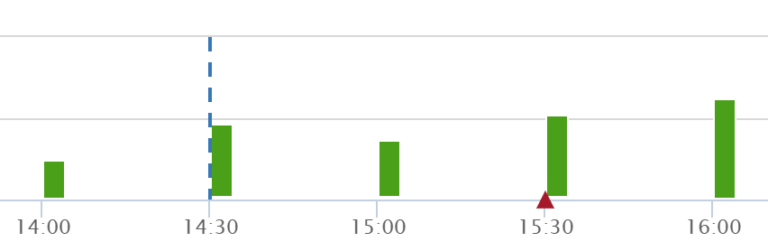
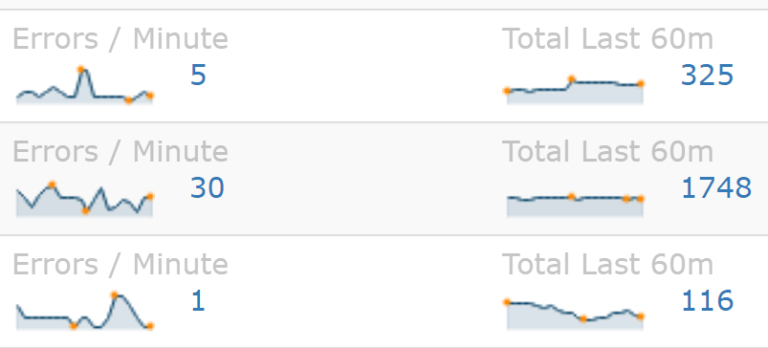
Quickly identify big spikes in errors before all of your customers are impacted
Get notified when a new type of error is discovered within your app
Stackify’s powerful code profiling is the heart of Retrace and Prefix. Our goal is to make it easy for to improve your code’s performance.
Stackify’s powerful code profiling and tracing is the heart of Prefix. Our traces increase visibility into poor-performing dependencies. This is especially useful when working with legacy code, framework sections, and finding hidden exceptions.
Retrace integrates error tracking and application logging with its APM code profiling functionality.
Identify new errors that happen just after a new deployment. Monitor error rates to ensure your application is running smoothly.
Retrace integrates with common deployment tools like Jenkins, Team City, Octopus and many others.
Retrace supports .NET logs via log4net, NLog, Serilog, or our .NET SDK.
Example configuration for log4net:
<log4net>
<root>
<level value="DEBUG" />
<appender-ref ref="StackifyAppender" />
</root>
<appender name="StackifyAppender" type="StackifyLib.log4net.StackifyAppender, StackifyLib.log4net" />
</log4net>
Retrace supports Java logs via logback, log4j, or our Java SDK.
Example configuration for log4j:
<appender name="Stackify" class="com.stackify.log.log4j12.StackifyLogAppender">
<param name="apiKey" value="YOUR_ACTIVATION_KEY"/>
</appender>
<root>
<appender-ref ref="Stackify" />
</root>
Retrace supports PHP logs via Monolog, log4php and Syslog.
Retrace supports Node.JS logs via Winston.
Retrace supports Ruby logs via the Rails logger.
Retrace supports common logging frameworks for most programming languages. A simple configuration change is all that is needed.
Retrace APM can also automatically collect exceptions being thrown in your code, including many hidden exceptions!
Logging libraries for many other languages are also supported in addition to our REST API.
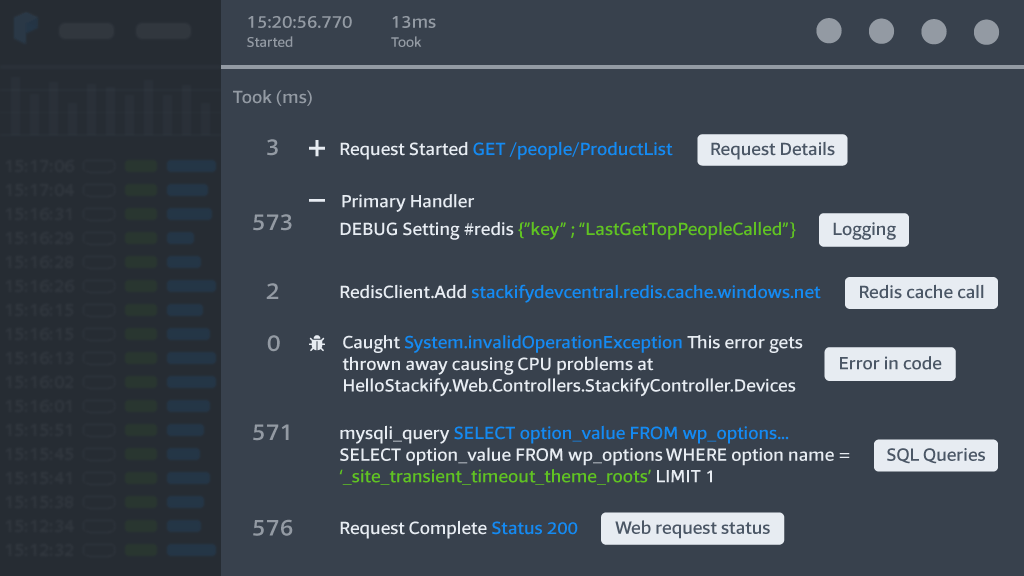
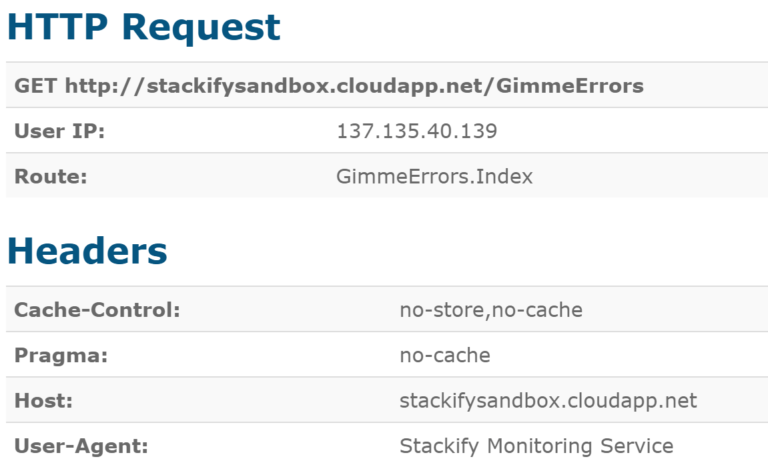
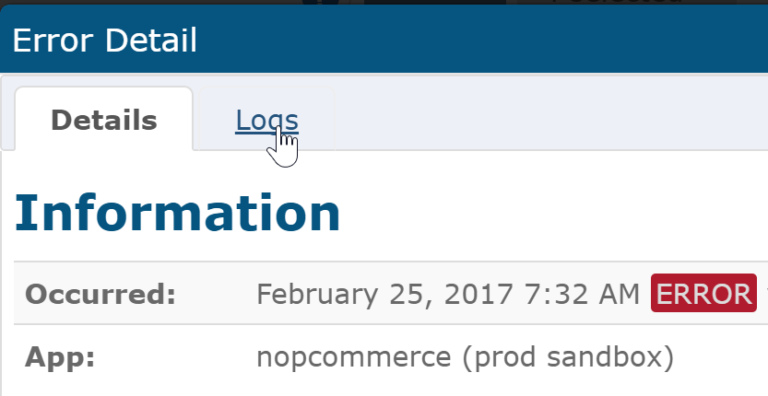
For every error that you log, Retrace will attempt to collect any details about the current web request. These details are very valuable to get more context.
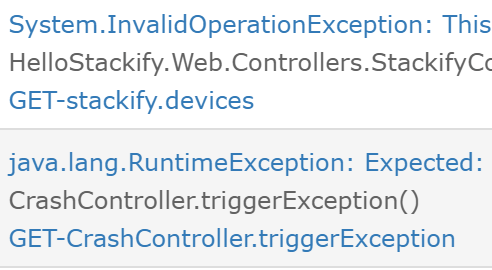
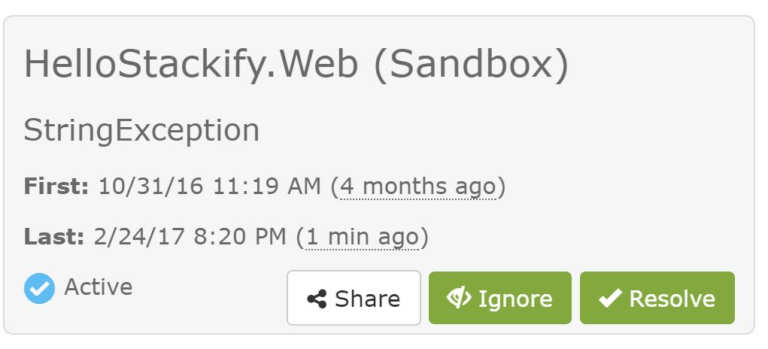
One of the key features of any error tracking system is the ability to de-duplicate and uniquely identify errors. This enables you to track how often each individual error occurs and enable alerts for new errors.
You could send all of your errors to Elasticsearch, a database, or a log management system. Unfortunately, those systems don’t understand how to uniquely identify errors.
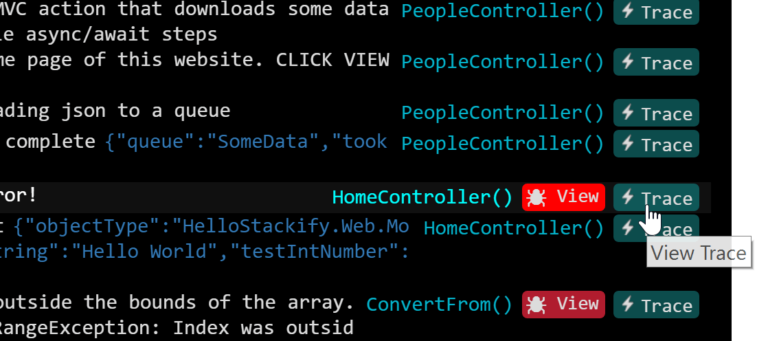
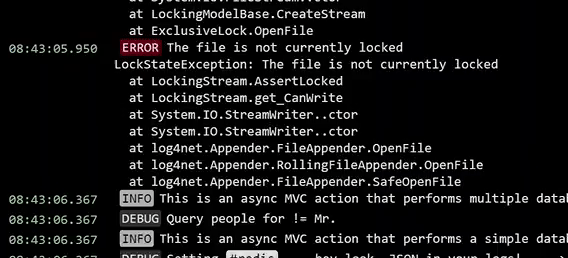
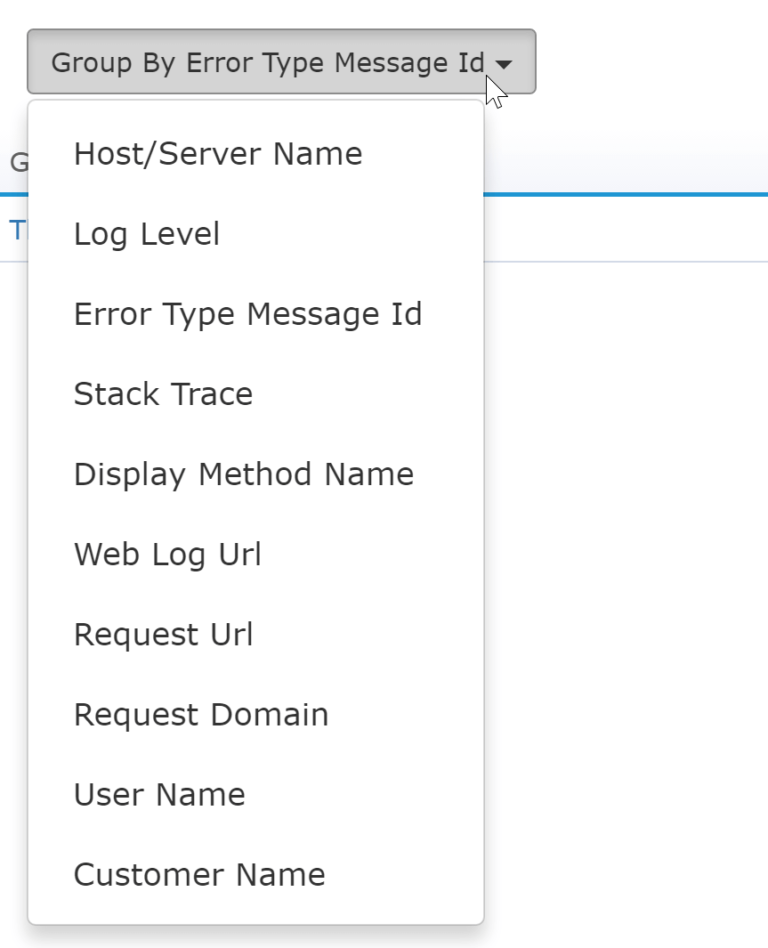
Trying to troubleshoot something in production? Use Retrace to search and filter for exactly what you are looking for and then turn on tailing mode. The log viewer will automatically update with new errors and logs.
Since Retrace provides both error tracking and log management in one solution, you can view all of the log messages that are related to an error. Being able to see the related log messages provides much more context about what your code was doing.
Usually, within 5-10 minutes, we know what's happening. It's made our DevOps team so fast.
Without Retrace, we would likely have a lot more development time to try and figure out what a client is talking about. There would be very little, if any, data for us to look at.
Co-Founder | MyRacePass
Retrace made identifying bottlenecks simple and we are able to quickly fix them.
Stackify Retrace's pricing allows us to run diagnostics on more servers concurrently rather than having to constantly swap licenses around as needed.
Engineering Lead | ROC Commerce
Retrace's APM lets us monitor this and focus our development efforts where it matters most. With redundant monitoring of Azure and Retrace and the really granular early alerts we've set up in Retrace, I feel much more confident about finding critical issues before they turn into fires.
Co-Founder | Crelate
Quickly identify problems with your software by monitoring your error rates. Get notified instantly when problems suddenly arise with a database query, external web service, or other application dependencies.
Retrace APM will alert you and give you all the details to identify the root cause.
Some errors happen all the time and are essentially noise. They could be errors that you can’t fix in your code or they could be random SQL timeouts or similar errors.
With Retrace you can ignore specific errors. They still get tracked if you need to see them, but they get suppressed from normal reporting so they don’t skew your reporting.
Retrace collects a lot of context data about what is occurring when an error is thrown. This data can be very useful for error reporting purposes.
Get all the details you wish your logs had with no code changes. Retrace automatically collects the details you need to quickly troubleshoot application errors.
Retrace works out of the box with popular programming languages, as well as common frameworks, such as Syslog, Web Server Logs, Windows Events, and more. View our complete list of supported integrations.
Get Started with Retrace Today.