 |
VOOZH | about |
|
VOOZH | about |
We’re so glad you’re here. You can expect all the best TNS content to arrive Monday through Friday to keep you on top of the news and at the top of your game.
Check your inbox for a confirmation email where you can adjust your preferences and even join additional groups.
Follow TNS on your favorite social media networks.
Become a TNS follower on LinkedIn.
Check out the latest featured and trending stories while you wait for your first TNS newsletter.
I regret never having studied calculus in school, and over the years I’ve made a few efforts to fill in that gap in my knowledge. It would have been a different story, I’m sure, if I’d been lucky enough to have Eddie Woo as a math teacher; it’s amazing to have his classes available on demand. I’ve also learned from Sal Khan’s videos, and this time around I went back to Khan Academy to see how its integration of ChatGPT changes the learning experience.
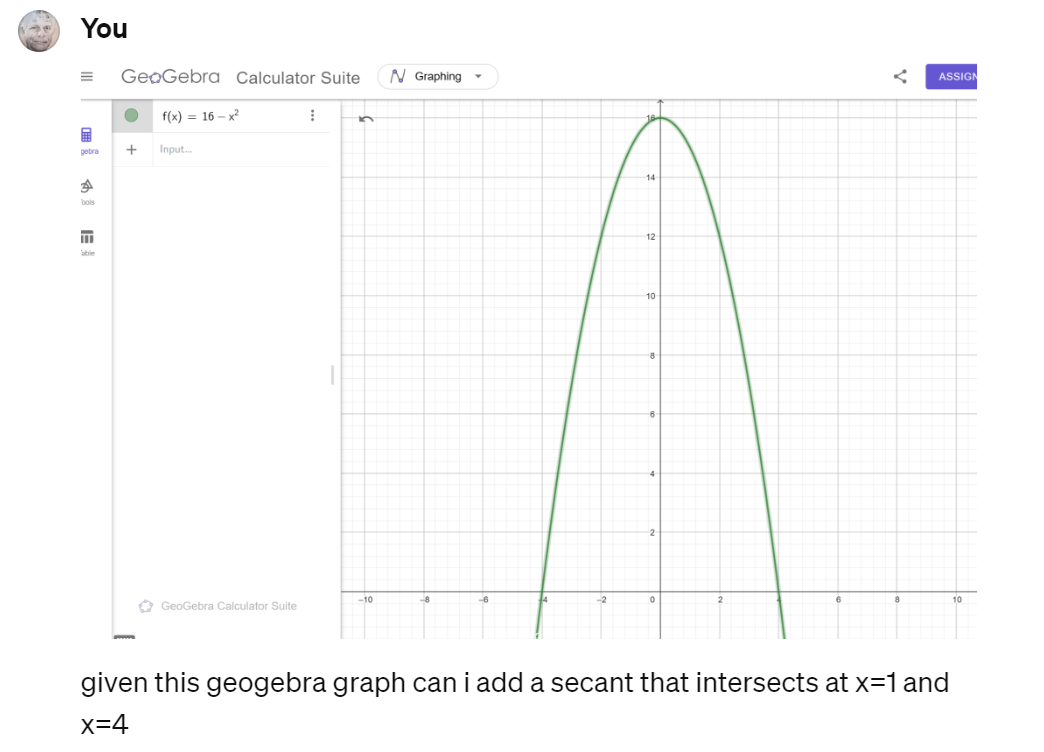
As I began working through an exercise, the Khan site presented me with a chart made with a tool I’d never heard of: GeoGebra. I realized it would be helpful to know how to use that tool to graph the concepts I was working with: a parabolic equation; a secant; and the run, rise and slope of the secant. I got as far as charting the parabola, using f(x)=16-x^(2), but wasn’t sure how to proceed. So I asked ChatGPT.
It provided these GeoGebra inputs:
ChatGPT
 A = (1, 16 - 1^2)
 B = (4, 16 - 4^2)
 line(A, B)
I used those inputs to plot the points and draw the line, and also verified that I could have used the Point and Line tools to do the same things manually.
Then I showed my progress — by pasting in another screenshot! — and asked about the slope of the line. (You can’t yet do this with Khan’s integrated assistant, but you can do it directly in ChatGPT.)
ChatGPT
 perpendicularLine[A, x-axis]

 perpendicularLine[B, y-axis]
That didn’t work, as ChatGPT acknowledged when I showed it the result of its instructions.
It had already shown me the recipe that those erroneous inputs were intended to shortcut: create a triangle with A, B and a new point C directly to the right of A and directly above B. Now it repeated those instructions for doing these things manually, using the Line tool, and also gave me new shortcuts.
ChatGPT
 RunLine: Line[A, A + (1, 0)]

 RiseLine: Line[B, B + (0, 1)]
That worked, but by now I was getting the hang of GeoGebra and realized I really just wanted segments like this.
 C = Point(4,15)

 run = Segment(A,C)

 rise = Segment(B,C)
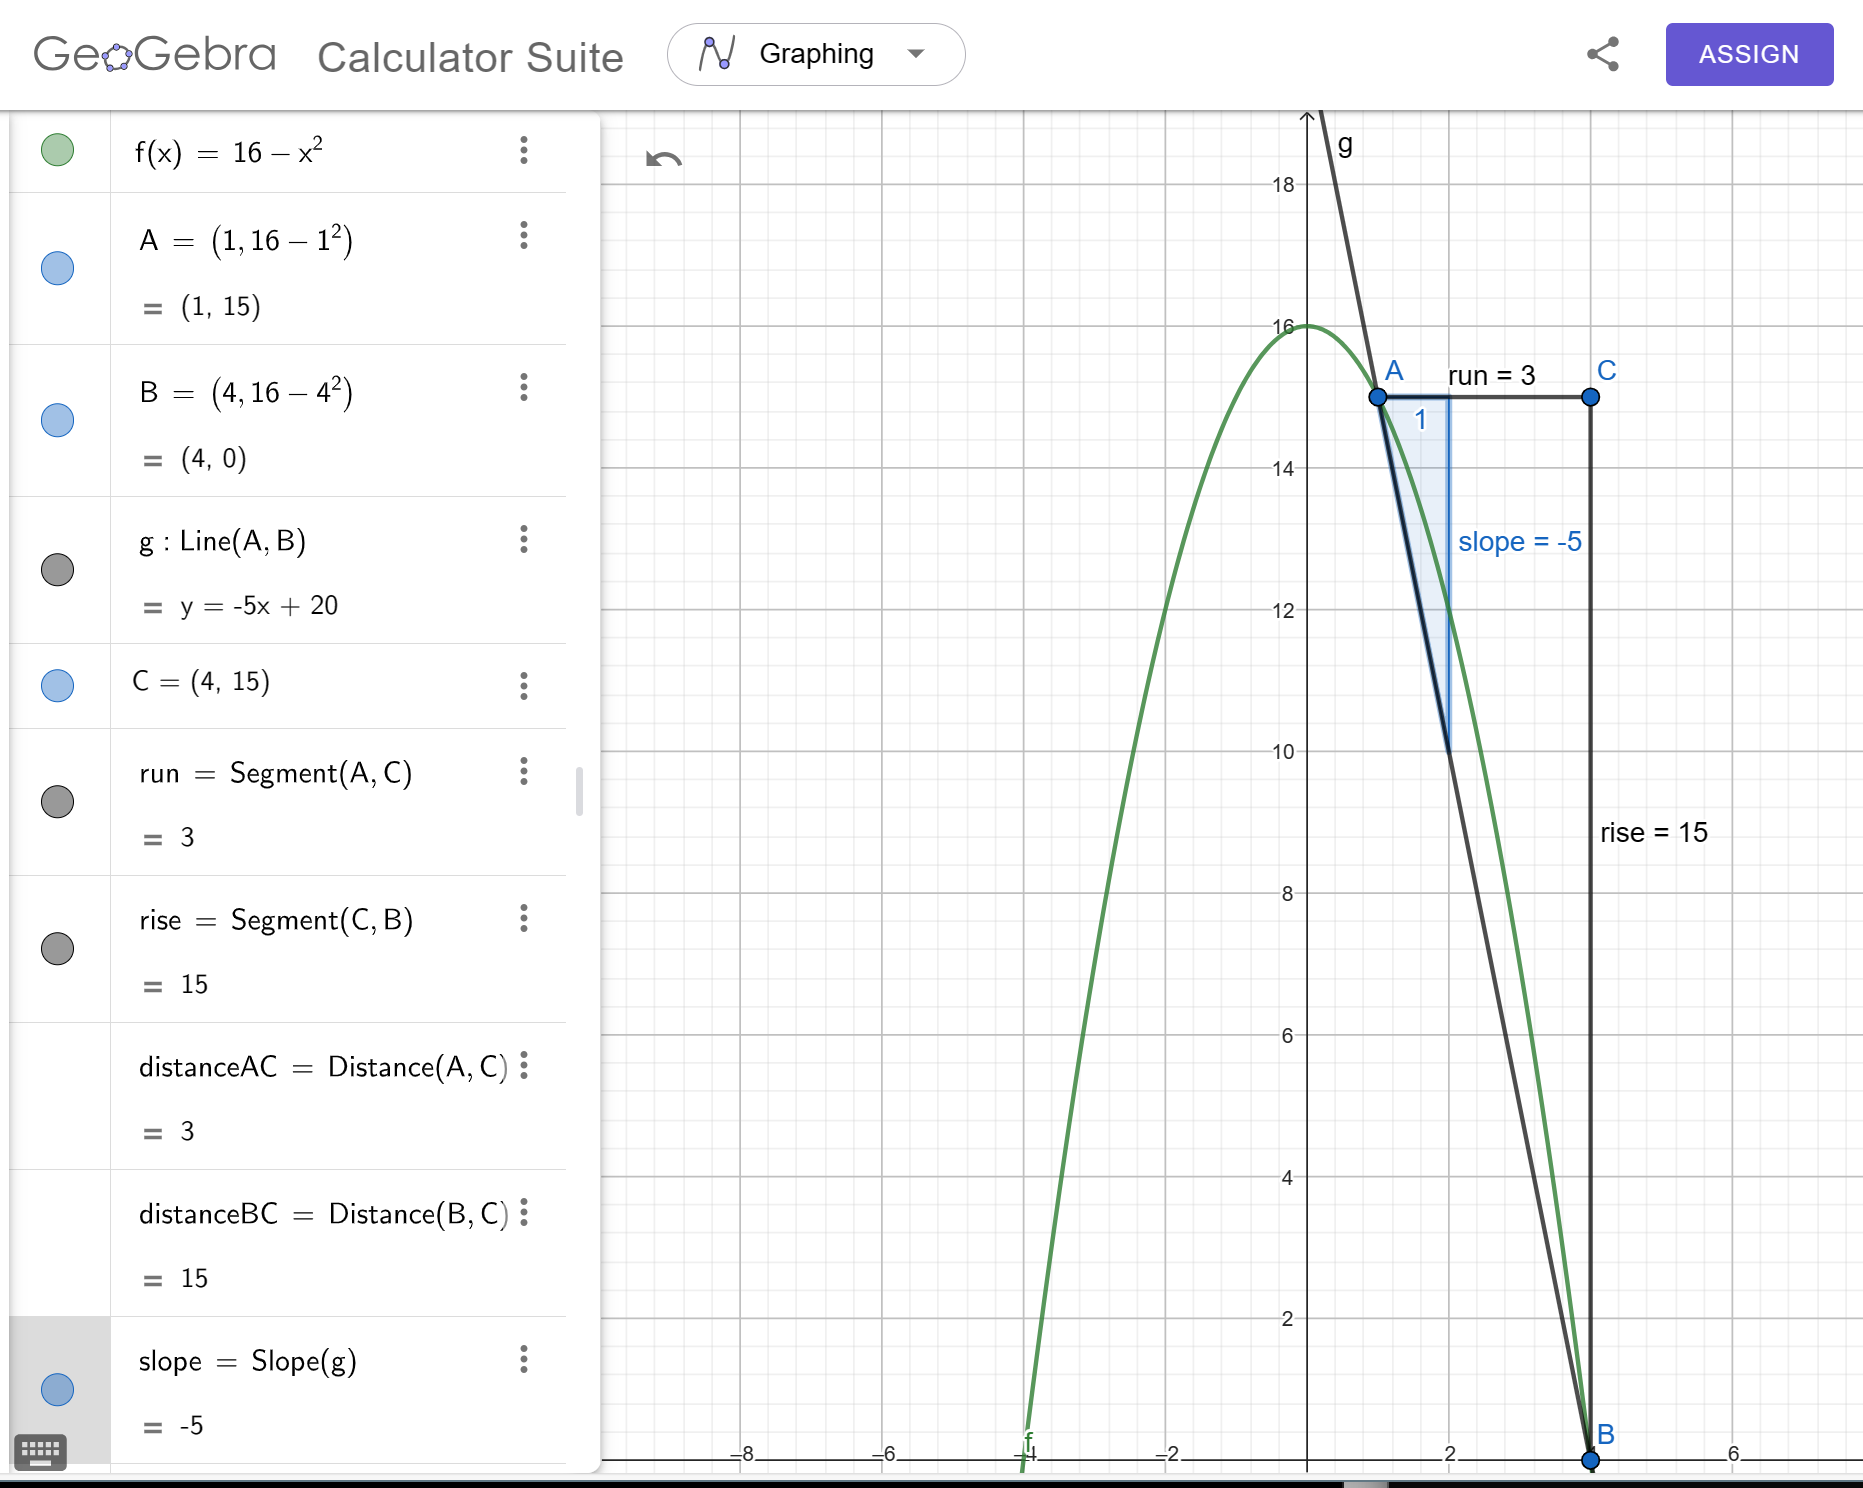
Next, I wanted to show the slope and display the lengths of the segments. ChatGPT gave me the right input for the slope: slope = Slope(g). But its recipe for displaying the lengths of the segments entailed adding unnecessary lines, labels, and hardcoded measurements. I found a better way.
Here was my final result:
It’s a great example of rule 7 from 7 Guiding Principles for Working with LLMs: Learn by Doing. In the pre-LLM era I would have gotten to the same result eventually, but this was a radically better experience. Of course, it would be ideal to work through the exercise with a human coach who knows both the math and the GeoGebra interface, but in reality that’s rarely possible. Iterating on my graph attempts with ChatGPT was a great way to jumpstart my GeoGebra experience. ChatGPT’s knowledge of the tool’s interface, while imperfect, was very helpful. And its mind-boggling ability to see and react to my attempts points to a whole new way of learning how to use software.
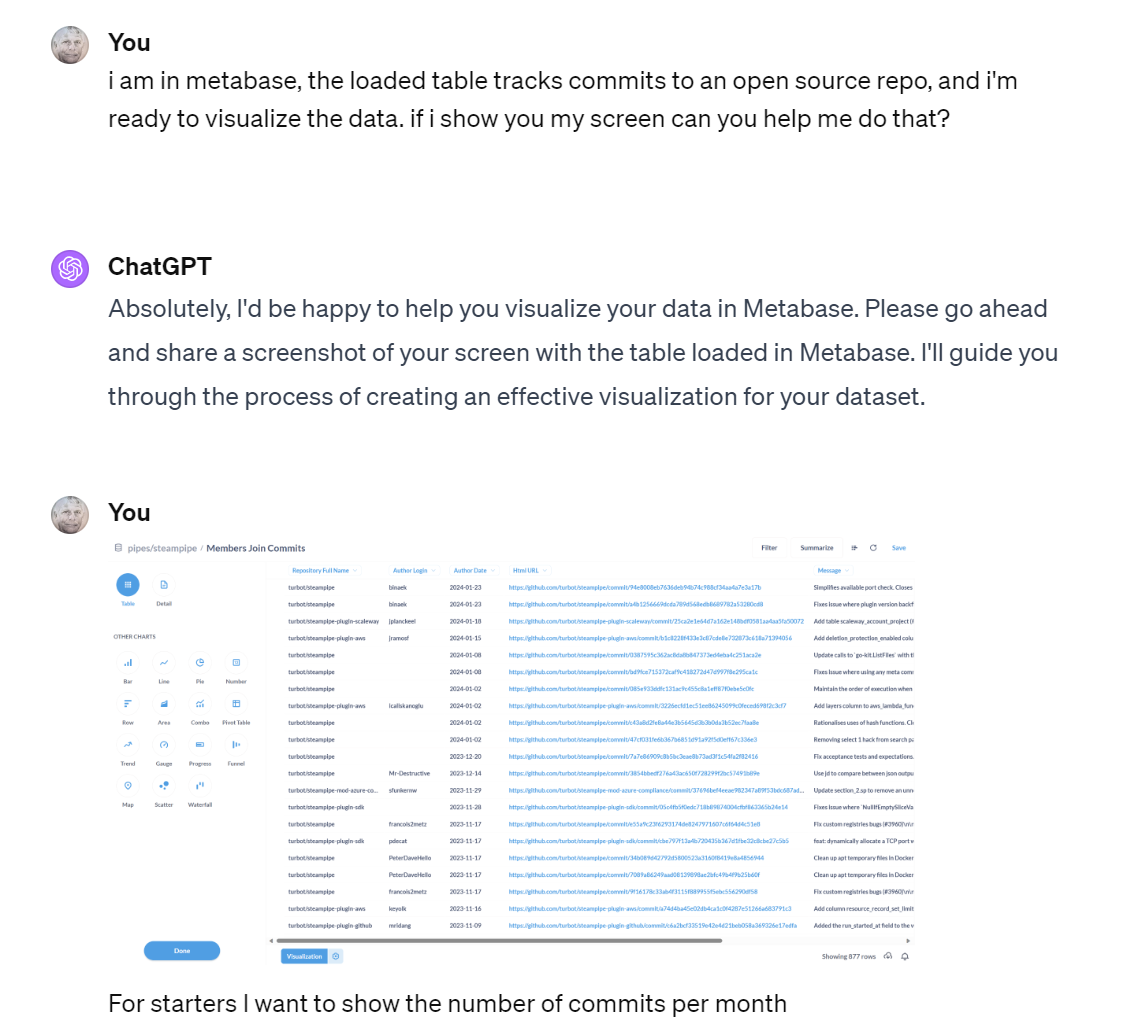
To check whether this was a fluke, I switched to a different task: visualization of query results in Metabase. In this case, I had a lot of experience with the software, but it had been a while since I’d touched Metabase. My knowledge of it was rusty and Metabase had likely changed in the interim.
To start, I pasted an image of a Metabase question that showed a sample of the data, along with the tool’s visualization pane, and asked how to chart commits by month.
ChatGPT
You’ll need to aggregate your data by month. To do this, you can use the “Summarize” option.
In the Summarize menu, look for the “Group by” option.
Choose the “Author Date” column to group by.
Then, you should have the option to adjust the grouping to be by “Month” instead of by “Day” or “Year”.
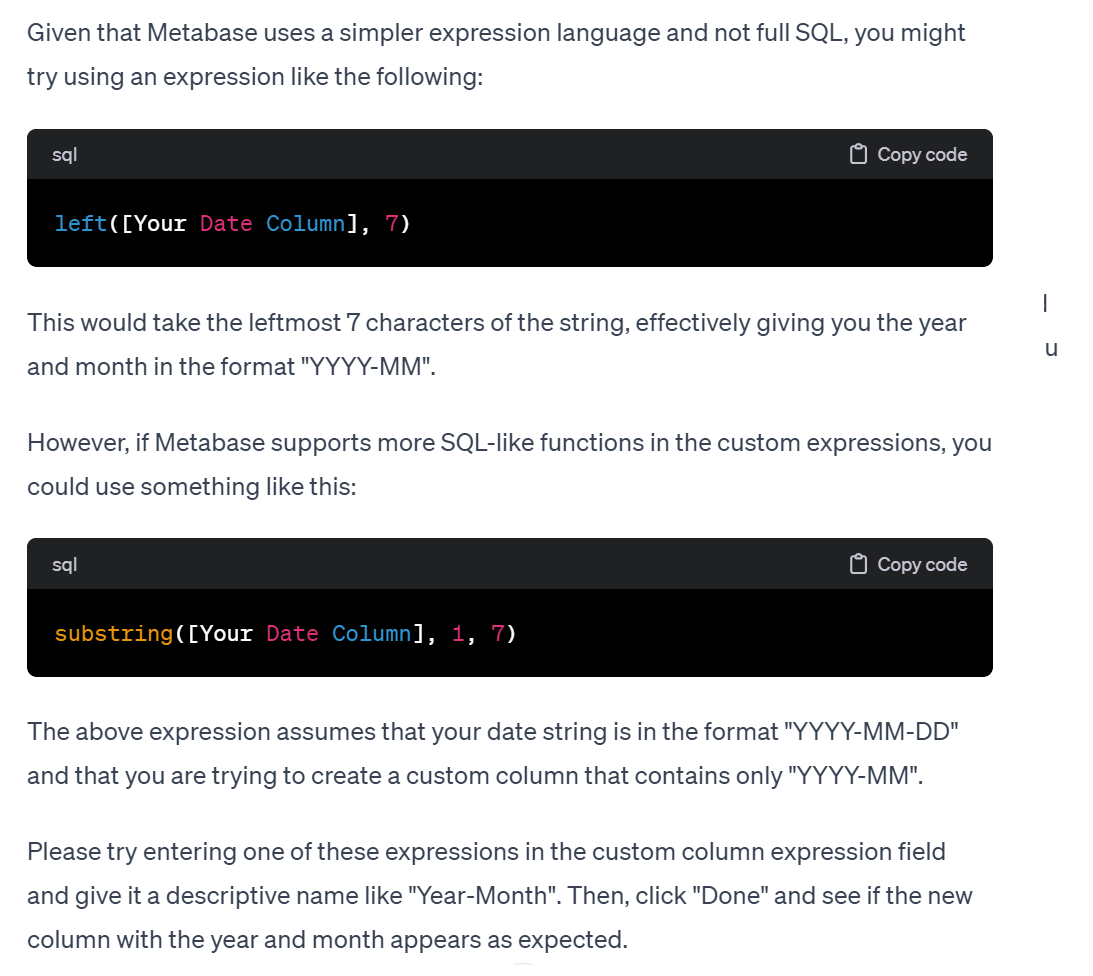
That was right with respect to Summarize and Group By. But there was no option to group by month. Maybe there used to be, or maybe ChatGPT got that wrong. Poking around in the Metabase interface I rediscovered the ability to create a custom column, and realized I needed to derive a YYYY-MM column from the YYYY-MM-DD-formatted Author Date column. How? ChatGPT provided two plausible approaches, the second of which worked.
Now I wanted to count the number of distinct contributors per month. These instructions worked.
ChatGPT
Use the “Summarize” option again to add a new metric.
You’ll want to add a count of distinct contributors. To do this, you should choose the “Count of distinct…” option, which might be represented as “Count Distinct” or something similar.
For the distinct count, select the “Author Login” column since this is what identifies each contributor.
Metabase should automatically recognize that you have two different metrics and offer you to create a multi-series chart.
It did. At this point I realized the Author Login column contained nulls that I should remove; these were my instructions.
ChatGPT
Open the Filter Menu:
Find the “Filter” button in the query builder interface, which is usually near the “Summarize” button.
Add a New Filter:
Click on “Filter” and then choose to add a new filter.
Select the Column to Filter:
In the filter options, select the “Author Login” column.
Set the Filter Criteria:
Set the criteria to “Is not” or “Does not equal” and then select or type “null”. This tells Metabase to filter out any rows where the “Author Login” is null.
The actual criterion turns out to be not empty. That was obvious to me, but what if you weren’t sure? I showed my screen and asked to verify the choice.
Quite remarkably, ChatGPT not only confirmed that not empty was the right choice, but it could apparently detect that I had already selected it.
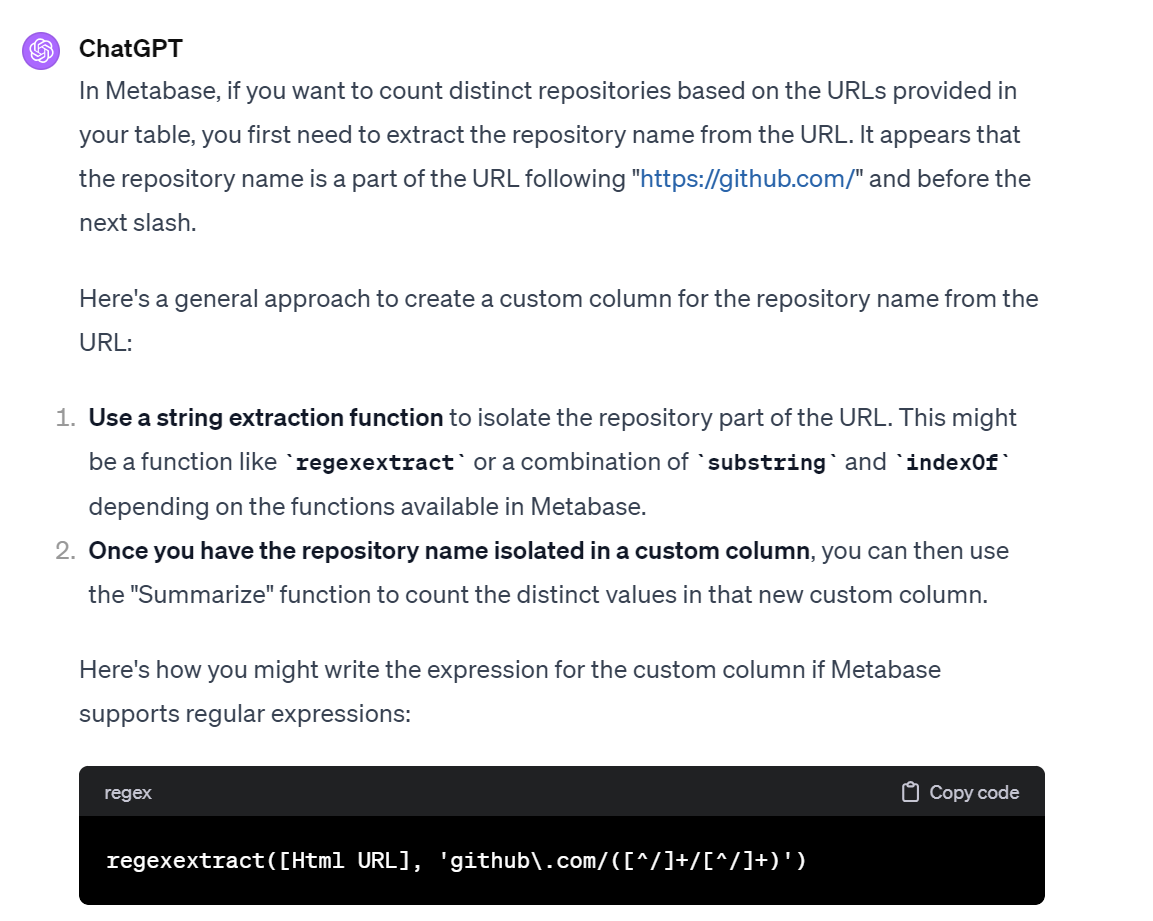
Now I wanted to count the number of distinct repos per month. That information is implicit in the data — the html_url column includes repo names that just need to be extracted with a regex. I never gave ChatGPT a string like https://github.com/turbot/steampipe/commit/a4b12…, nor a hint about using a regex to extract the repo name (turbot/steampipe, in this case), but there was no need for any of that. It figured out what to do and showed me how.
As it turns out, regexextract is the correct Metabase function, and that was exactly the right incantation for my new custom column.
As with GeoGebra, ChatGPT’s knowledge of Metabase was incomplete but still very helpful. And the workflow, which again entailed showing screenshots of intermediate results, was again shockingly effective.
In How to use LLMs for Dynamic Documentation I pointed out that asking LLMs for on-the-fly comments on code can be a useful complement to comments written by code authors. It looks like LLMs will be able to usefully complement software documentation in a similar way.
Ideally, tools like GeoGebra and Metabase provide interfaces so intuitive that you rarely need to read the docs, and you can learn the software just by poking around in it. In reality, of course, we need those docs — and they still need to be excellent. But now, we’ll extract a new benefit from them. When we can partner with machines that have read the docs, and can look over our shoulders as we try to do the things described in the docs, we’ll turbocharge our ability to dive into unfamiliar software tools and quickly learn how to use them.