 |
VOOZH | about |
|
VOOZH | about |
We’re so glad you’re here. You can expect all the best TNS content to arrive Monday through Friday to keep you on top of the news and at the top of your game.
Check your inbox for a confirmation email where you can adjust your preferences and even join additional groups.
Follow TNS on your favorite social media networks.
Become a TNS follower on LinkedIn.
Check out the latest featured and trending stories while you wait for your first TNS newsletter.
kubectl commands or plugins which you can install via krew. If you don’t want to use the plugins, you can usually get the same information from kubectl, but the plugins will format the data to make it easier to debug.
We will make the assumption that your code works, and you know which application is broken and where it’s running. Kubernetes can’t fix broken code. But if your container won’t start or the application gets intermittent errors, here’s where you can start. We’ll skip specifics — such as finding which cluster, region or namespace the application is running, or which version is current — because those will be unique to your environment.
There are different types of workload errors, so we’ll break it down into three stages of troubleshooting:
spider*, $LABEL or $POD in a command, you should replace it with your workload name.
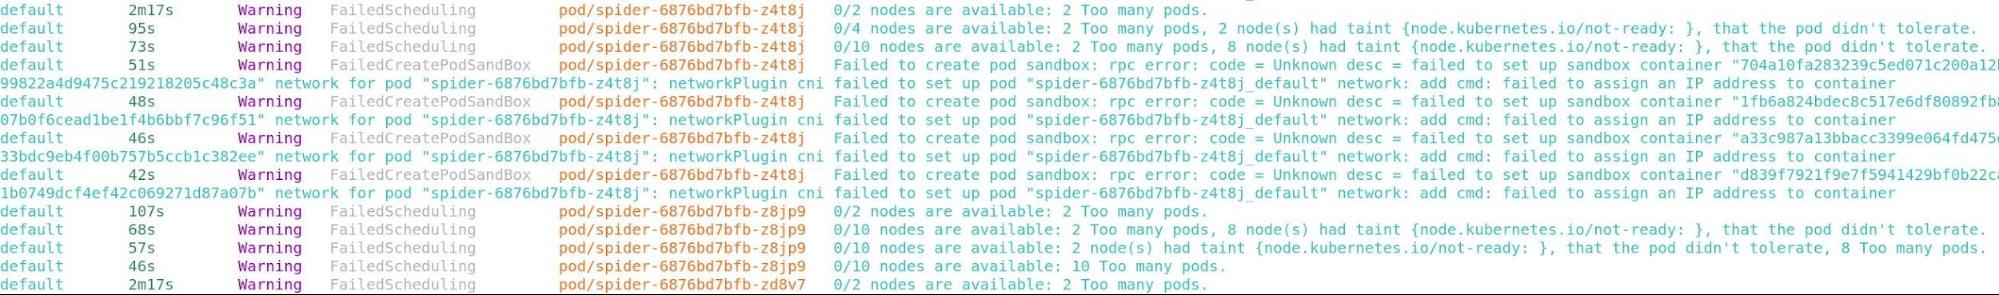
kubectl get events --field-selector type=Warning --all-namespaces
kubectl get nodes -o wide --label-columns topology.kubernetes.io/zone
kubectl resource-capacity --pods --util --sort cpu.util
kubectl get all --show-labels
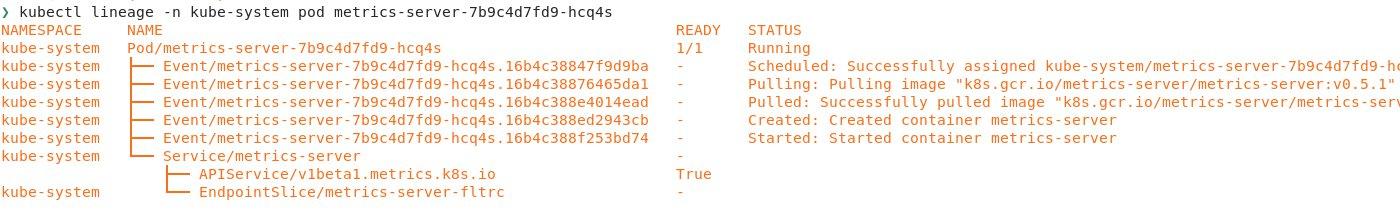
kubectl lineage pod ${POD}
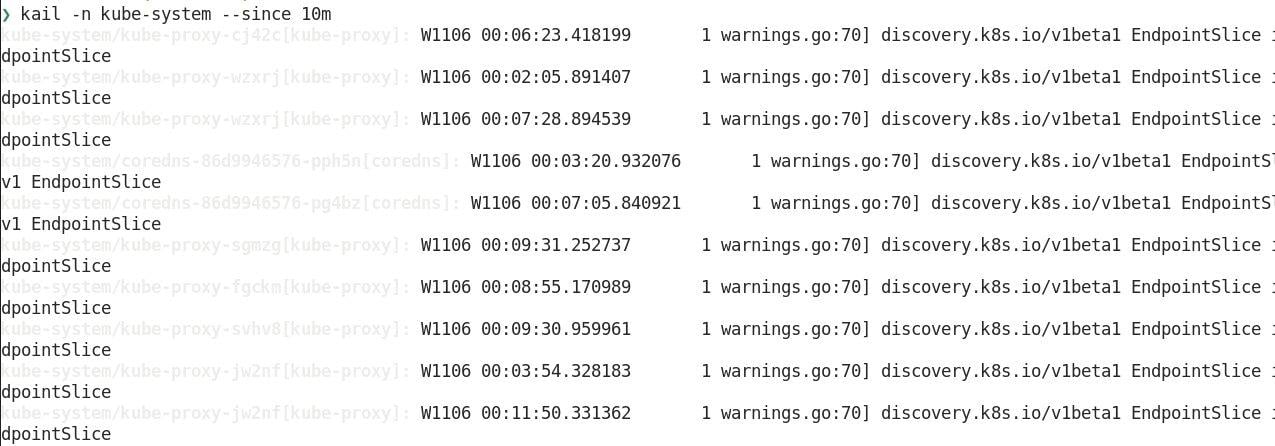
kail -l ${LABEL}
-n $NAMESPACE for your particular workloads. The ultimate goal of all of these commands is to get you to the log line or error message that says why something didn’t run. That could be from your infrastructure provider, a Kubernetes controller or your application.
kubectl krew install resource-capacity.
It’s important to note: This plugin requires that you have the metrics-server installed in your cluster. Once you have it running, you should be able to use this command to find potential problems where resources are limited or where pods do not have limits set.
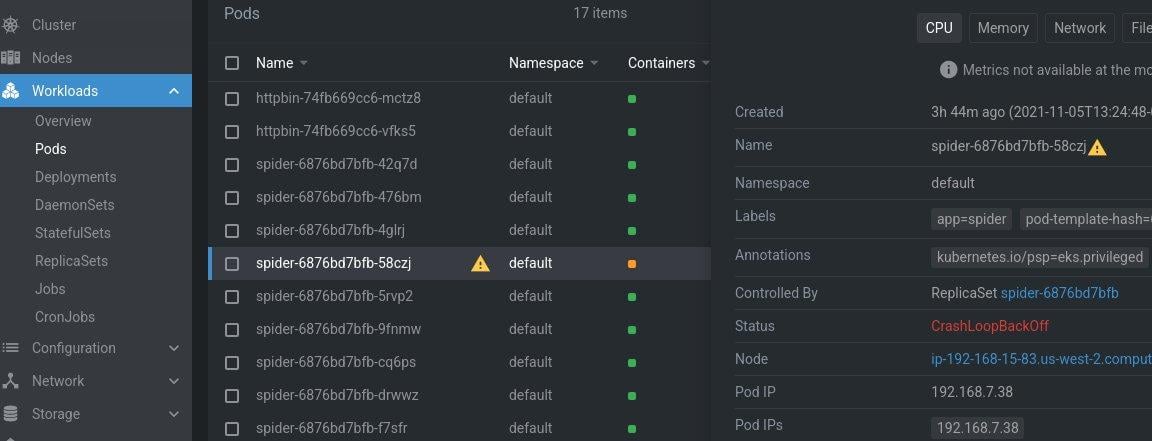
pod-template-hash label, which will give us a hash value you can match between our deployment and pod. If any pods are not running, we know where to look next.
At this point it’s good to look at the service too, to see what type it is. If it’s a LoadBalancer type, then you should make sure a load balancer has been provisioned. If all your pods are running, then the application problem might not be from the pods. Just in case, we should grab one of the pod names so that we can inspect it more in the next few commands.
kubectl plugin that can show what created a resource in Kubernetes and what depends on it. If you’ve ever used kubectl tree, you’ll be familiar with lineage, but lineage has a few extra features. You can install the lineage plugin with kubectl krew install lineage.
One of my favorite features about this command is that not only does it show the Kubernetes resources like ReplicaSets and services in the cluster, but it also shows events, RBAC (role-based access control), nodes, and has native helm support. By default, the command will show dependents, but with the --dependencies flag you can see what depends on a resource.
Just for fun, you can look at a service like the metrics-server and see all of the ClusterRoleBindings as well as the pods and nodes behind the service.
👁 metrics-serverkubectl plugin, that can be installed with brew install boz/repo/kail. The benefit of making it standalone is that it can do some things that normally would be hard with a single kubectl command.
For example, you can get all logs from a specific namespace with --ns or all of the pods behind an ingress rule with --ing.
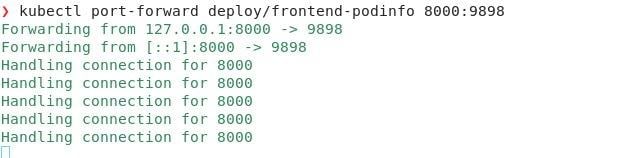
👁 kail -lkubectl get service -o wide kubectl get endpointslices -o wide kubectl port-forward deploy $DEPLOYMENT $LOCAL_PORT:$POD_PORT
kubectl get ingress -o wide. The important thing to check is what type of service it is, if there’s an external IP address or load balancer, and what labels are used.
From the data we collected from listing workloads earlier, we should be able to compare the labels being used on the pods with the matching labels on the service. If they don’t match, they won’t be part of the EndpointSlice.
kubectl debug -it --image=debian $POD
kubectl label pod $POD app-
kubectl blame pod
debug is my favorite. The debug command is different from exec because exec requires that your pod already has debugging tools installed in the pod. However, the debug command will let you specify a new container that you can “mount” to the running pod and then bring your own tools.
You can supply whatever container you want with tools for your --image; different errors might require different tools. I usually have a dedicated debugging container with pre-installed tools, but if you don’t have one around, you can use a full distro that you’re familiar with to install whatever tools you need. One cool thing about using an ephemeral container to debug something is that this also works for static binary containers that were built FROM scratch and have no other files or package managers.
The debug command can also be used to get an interactive shell on the node. This is similar to SSHing into the node, but the debug command runs the container in privileged mode with your tools installed. This is especially useful if you’re using a minimal container OS or do not configure SSH access on the nodes.
There are some more options on getting an interactive shell to a pod in the Kubernetes documentation.
app=nginx. When you expose the deployment with a service, it also matches on that label. By running this command, you’re removing the app label from the pod.
Because the replication controller and service objects match labels, once you remove the app label, a new pod will replace the pod you removed the label from, but it will leave your pod running. You now have a pod you can troubleshoot without worrying about sending it production traffic or the pod being scaled up or down from a horizontal pod autoscaler. The pod is effectively not tracked when you remove the labels.
In the screenshot, you can see that I removed the app label from the httpbin pod, which caused a new pod to replace it in the ReplicaSet and left the old pod available for me to debug.
kubectl krew install blame. With this output, you can quickly figure out what controllers modified the manifest and maybe look at those components to see why they changed it.
The output here isn’t perfect; it won’t show every modification to a manifest. Some of the fields are modified before they’re stored in etcd because of webhooks or default values. But it’s still incredibly powerful to know how often a field is changing and what controllers are modifying which fields in the manifest.
kubectl krew install gadget, and kubectl-capture, which creates capture files you can replay using tools like sysdig-inspect.
Both of these plugins require you to install DaemonSets on the nodes, but they can be extremely powerful if you need to dive deeper into problems with your workload. They both use kernel-level applications, using eBPF to understand everything happening.