
All public transport leads to Utrecht, not Rome
We all know the saying "All roads lead to Rome". But this not valid for public transport in the Netherlands, where they lead to Utrecht
Hands-on Tutorials
We all know the saying "All roads lead to Rome". In this article I will show you that this not by definition valid for public transport. In fact, in the Netherlands all public transport leads to Utrecht.
Yes, we all know the saying "All roads go to Rome". In this article I will show that a lot has changed in the last 2000 years. It might still be true that all roads go to Rome, but in the Netherlands the public transport does not. It all goes to Utrecht, Utrecht Central Station. There are several visualizations of all roads leading to Rome but for the first time I will show you that public transport goes to Utrecht.
This will be based on the GTFS data of the Netherlands, the trip planner OpenTripPlanner and some magic with GeoPandas and Python. These will be used to calculate the route between all public transport stops and Utrecht and plotting the map of routes.
The complete code of this article can be found on Github.
Calculating all routes to Utrecht
The first step is calculating all routes to Utrecht from all public transport stops in the country. All planning calculations are performed with OTP. OTP requires a OpenStreetMap PBF file of you region of interest for streets and walking times and the GTFS for the public transport timetable. The OTP jar is downloaded from Maven . The -shaded version is used for simplicity as it includes all dependencies. The OSM PBF is obtained from the GeoFabrik and is named ‘netherlands-latest-osm.pbf’. The GTFS is downloaded from OVapi and downloaded as zip (‘gtfs-nl.zip’). All three files are stored in the same location.
OTP is started from the command-line:
It will locate the OSM and GTFS files in the current directory and start building the network graph. Due to the size (we are creating a map for a whole country, not a single city) this will take some time but finally the OTP server is started. The 12G heap size is required to able to load the network graph in memory. To test the server, try the URL http://localhost:8080. Besides the webinterface, there is a REST API for using the OTP-server which will be used in the code below.
All public transport stops (bus, tram, metro, train, etc) are used. From each of these stops the route to station Utrecht Central is calculated. First, the set of routes to calculate is compiled.
The dataset contains the start and stoplocation, whereby the stop location is the GPS location of the square in front of station Utrecht Central. The dataset also contains the date and time for the route calculation which is the same for alle routes to calculate, in this case March 17th 2021 at 16:00. The GTFS dataset of stoplocations might contain duplicate entries so these are removed to prevent superfluous calculations.
The GTFS data of the Netherlands also contains some stations abroad as these are reachable with international trains. These stations outside the country are removed by using the country boundaries as available with GeoPandas.
The country boundary is obtained from a world borders dataset available in the GeoPandas distribution(lines 4 and 5). The startstop dataset is converted to a GeoPanda (lines 1 and 2) and joined with the boundary dataset with the sjoin command, the spatial join. This join joins two datasets on their geospatial relationship, in this case it determines if each point is inside the boundaries of the nl GeoPanda. Finally, the dataset is filtered so it contains only the points in the Netherlands.
The routes dataset is now used as input for the route calculation. For each entry in the dataset the route by public transport is calculated and added to the dataset with all legs (a calculated route contains one or more legs):
For each row in the routes dataframe a planning request is send to OTP. The result is a JSON with a description of the route. A route consists of one or more legs. For each non-walking (transfer) leg the routedetails are stored and added to the resulting dataframe. This step will take, depending on the available hardware, several hours. Please be patient 🙂
Most legs will be used by multiple routes. The last two lines count the number of occurences per leg and removes duplicate leg entries.
Calculation of segments
In the next step we can use the start/stop locations from the legs and reconstruct the journey with the GTFS dataset. But conveniently, OTP returns the GPS track of the leg as Google polyline. Decoding this string the (lat,lon) pairs is "slightly" simpler than reconstruction based on GTFS, but still some hassle. Luckily example implementations can be found online.
All legs are decoded to their underlying segments, where a segment is a (lat,lon) pair. This is a straight line on a map. The number of occurences from the leg is copied to the segment. The last step combines all equal segments and sums its occurences.
We now have a dataset of (x,y) pairs in latitude-longitude format with the number of occurences of this segment in all planned routes.
Plotting segments
The last step to perform before we can plot the data is transforming the segments dataframe to a GeoPanda dataframe consisting of LineSegments between the two pints.
The last line normalizes the count of occurences to a line width between 0 and 5. Our first plot only plots the segments to check the contents of the final dataset:
This image shows all public transport routes and looks correct. It gives a very nice overview of all public transport lines in the country. Observe how the bus over the Afsluitdijk is surprisingly part of the graph. From one or more locations in Friesland it is faster to go to Noord-Holland over the Afsluitdijk. And from the south-west (Zeeuws-Vlaanderen) some routes go through Belgium. This can be seen clearly if we add a map to the image:
The final step is to use the calculated width for the segments in the plot. In order to improve visibility, the [0,5] range width is reduced to [0.1, 2.9]. Without this adoption the thickest lines would be too thick and clutter the image while the thinnest lines are invisble.
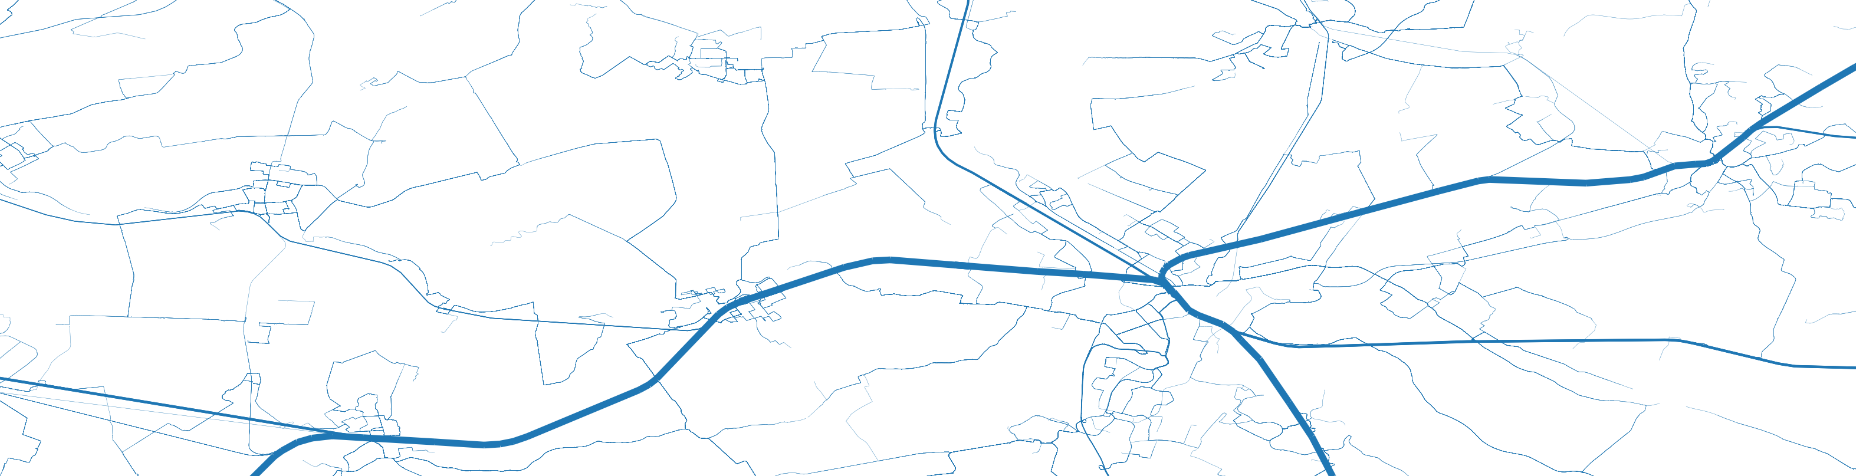
Here is the final result, showing that all public transport goes to Utrecht indeed:
The map shows all the routes from all public transport stops in the country to Utrecht Central station. The thickness of the line represents the number of stop locations served by the line. It does not represent the number of passengers, only the number of stops. But the map looks magnificent, it is like the cardiovascular system of the country.
I hope you enjoyed this article. For more inspiration on using open data of public transport, check some of my other articles:
- Visualize the crowdedness of Dutch trains with Open Data and Kepler
- Visualization of travel times with OTP and QGIS
Disclaimer: The views and opinions included in this article belong only to the author.
Share This Article
Towards Data Science is a community publication. Submit your insights to reach our global audience and earn through the TDS Author Payment Program.
Write for TDS