
Data Science for Good: Beyond Profits, Towards a Better World
Use the Power of Data Analytics to Drive Positive Change in Your Company while Improving the Profitability.
Data science can support business transformations that go far beyond financial gains.
It can improve working conditions, reduce inequalities and promote an inclusive working environment.
As a senior supply chain engineer, I’ve mainly used analytics to improve operational performance and cut costs.
However, an engineer’s duty is not just about maximizing profit; she can also help make the world a better place.
As a Data Scientist, how can you improve working conditions of logistic operators?
In this article, I will share examples using data science to improve logistic operators’ working conditions (and bonuses).
Productivity & Profitability
Profitability of Logistics Companies
As a former supply chain solution designer, I spent the early years of my career helping logistic companies optimize productivity to boost profit.
I’ve witnessed the immense pressure our customers (Retail, Fashion, Luxury, Cosmetics) face to deliver goods on time while minimizing costs.
As third-party logistic providers, this pressure was directed to us with a constant fear of having our contracts not renewed.
In this stressful environment, the lure of cutting corners and adopting aggressive management tactics to reduce workforce costs is ever-present.
Let’s find a smarter way to work!
By embracing the power of data science to improve processes, we can avoid transferring this pressure on operators and drive positive change.
Definition of Process Productivity
Let’s take a hypothetical scenario of a major international fashion retailer building its distribution network with logistic companies.
I&N is looking to outsource its warehousing and transportation operations to deliver its stores in Shanghai.
The logistics team organizes a tender, also called a Request for Proposal (RFP), inviting global logistics companies to submit their solutions.
As part of the RFP, I&N’s logistics team provides
- Data and process requirements
- This quotation sheet outlines the different service prices for storage, receiving, box picking, piece picking, loading, and return management.
As the solution design manager, I was responsible for proposing solutions and calculating the price for each service.
The price was determined by considering the equipment and workforce costs driven by operators’ productivity and the margin on sales.
P.S: The margin on sales is defined as the percentage of the turnover that represents the margin.
Warehouse and transportation teams would run the operations for three years to preserve this margin.
This could be achieved by either increasing the price (which was nearly impossible) or reducing costs.
The latter option usually came down to one key factor: increasing productivity.
But how do you increase productivity?
This can be done with aggressive management tactics using high individual productivity targets, salary cuts and illegal labour practices.
It often leads to increased employee stress and dissatisfaction, which may impact your company’s ESG score.
❓ Do you want to know more about ESG scoring?
The second method is to optimise processes, layouts and goods flows to help operators become more efficient with the same amount of effort.
This approach not only benefits the company but also improves the working conditions.
To illustrate my point, I will share examples that I have implemented in my career for operations in the retail, fast fashion and luxury industries.
Better Productivity with Optimisation
Data science can be crucial in improving operators’ working conditions and wages.
Improving Picking Efficiency
Let’s start with an example from a re-engineering project. I used analytics to help operators improve their picking productivity.
Warehouse Picking can be defined as taking products from the stock to prepare an order (e-commerce, store delivery).
In a Distribution Center (DC), walking time from one location to another during the picking route can account for 60% to 70% of the operator’s working time.
Reducing this walking time can drastically impact its productivity.
Let us assume that operators pick full boxes
- Productivity will be in (boxes/hour)
- Price will be in ($/hour)
Warehouse operators have productivity targets that they need to reach to receive bonuses.
The pressure on operators in retail and FMCG operations is immense, as they represent a major part of fixed and variable costs.
What is the best way to help operators improve their productivity?
Maximizing the number of boxes picked per meter walked can help operators improve their productivity while minimizing their efforts.
In several articles, I propose several data-driven methods to reduce this walking distance and maximize operators’ productivity.
- Order Batching to increase the number of order lines picked per route
- Clustering of the picking locations to group orders by area
- Advanced pathfinding using Google-OR libraries to optimize the picking routes
These optimization approaches have been tested using actual order lines and warehouse layouts.
More Boxes Picked + Less Distance = Higher Productivity
Results show a huge decrease in the walking distance for the same scope of orders to pick.
Implementing these algorithms in your Warehouse Management System can boost operators’ productivity without changing any processes.
💡 For more details, you can have a look at these articles,
Improve Warehouse Productivity using Order Batching with Python
Improve Warehouse Productivity using Spatial Clustering with Python
Improve Warehouse Productivity using Pathfinding Algorithm with Python
Parcel Packing Process Design with Queueing Theory
Let’s switch now to e-commerce operations.
The online retail boom has put enormous pressure on fulfilment centres to prepare and ship orders at unmatched speeds.
How many orders can our warehouse ship per day?
In this example, a major problem of continuous improvement engineers is shipping capacity.
After picking, the orders wait too long to be packed and loaded onto trucks.
Based on on-site observations and productivity analysis our engineer understood that the packing process was the bottleneck.
She would like to redesign the layout and optimize the process to release pressure from packing operators.
The site manager decided to invest in a second packing station.
Therefore, our engineer wants to use the Queueing Theory to find the best layout.
Solution 1: Keep a single line with two parallel stations
Solution 2: Add a second line with a dedicated station
What is the best solution to minimize the queueing time and reduce bottlenecks?
Using concepts from the Queuing Theory, we can estimate the performance of the two layouts by considering the variability of input flow.
The analysis shows that the second solution is less robust and may reduce the packing station’s capacity when faced with volume variability.
Assuming that we have a variability of 1.5,
- -25% of the queueing time (seconds) in the packing line
- Higher overall productivity with the same packing speed
Thanks to this simple modelisation, she has designed a layout enabling operators to be more productive without additional effort.
💡 For more details, you can have a look at this article
Conclusion
You can redesign processes using advanced analytics tools to help operators be more efficient.
- Higher bonus for picking and packing operators (👩 🏭 )
- Less effort to walk or pack fast w/o pressure from managers (🧘)
- Better profitability for the company (💰 )
In the next section, we will discover other opportunities for data-driven improvement focusing on resource allocation.
Invest in Your Workforce (In a Smart Way)
The previous section focuses on designing an optimal process to maximize an operator’s productivity.
However, there is a gap between process design and execution that can be filled with optimization tools.
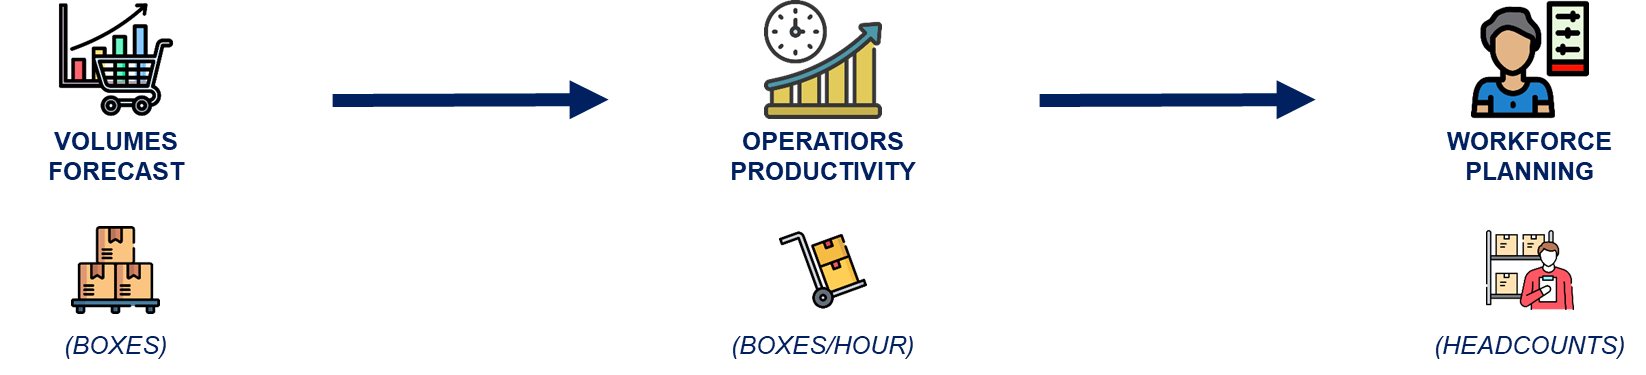
Workforce Planning for Inbound Management
For our fast-fashion customer I&N, we must plan the workforce to absorb the fluctuating demands of the stores.
I&N provides volume forecasts, like the one above, and the managers are planning the number of headcounts needed to meet the demand.
They must minimize the number of temporary workers hired while ensuring employee retention and adhering to local regulations.
In our example, we would like to help the Inbound Manager.
His team responsibilities include
- Unload Pallets from the Trucks
- Scan each pallet and record the received quantity in the Warehouse Management System (WMS)
- Put away these pallets in the Stock Area
The team has two types of productivity target
- Number of pallets unloaded per hour for each worker (I)
- Number of pallets unloaded per hour paid for the whole team (II)
How to Size the Workforce using volumes and productivity?
If the manager recruits too many operators the overall productivity (II) may be greatly reduced.
Based on volume forecasts, he can estimate what resources would be needed each day.
To ensure employee retention, you need to guarantee a minimum of 5 consecutive working days per week.
To help our inbound manager balance these constraints and objectives, we can use linear programming with Python.
The results of this optimization tool are satisfying,
- Except for Friday and Saturday, we do not have resources in excess
- The supply matches the demand every day
Except for these two days, the overall productivity is not affected by planning issues.
If the operators meet the targets, they will receive a full bonus without impacting operational margin.
💡 For more details, you can have a look at this article
Optimize Workforce Planning using Linear Programming with Python
Optimal Incentive Policy for Warehouse Operators
In this last example, let’s imagine you are helping a Regional Director of your logistics company with 22 warehouses in her P&L.
The objective is still to maximize the operators’ picking productivity.
She would like to use financial incentives to motivate operators to increase their outputs per hour paid.
The current incentive program provides 5 euros per day to operators that reach their target. (Daily salary: 62 euros)
However, this could be more efficient as only 20% of operators meet their target.
What should be the minimum daily bonus needed to reach 75% of the target?
The idea is to run a data-driven experiment
- Randomly select operators in your 22 warehouses
- Implement a daily incentive amount varying between 1 to 20 euros
- Verify if the operators reached their target
Using Logistic Regression, we get a probability plot that helps to estimate the probability of reaching the target for each value of the daily incentive.
Based on the trend, with a 15 euro incentive per day, we get a 75% probability of reaching the target.
This result, backed by statistical tools, provides valuable insight for our director to change her incentive policy.
💡 For more details, you can have a look at this article
Conclusion
We have discovered optimisation and statistical tools that help a company improve resource allocation to reach key operational targets.
- Higher overall team productivity and an improved margin (👩 🏭 )
- More incentives for the operators (💰 )
- Less pressure from managers (🧘)
Next Steps
Hopefully, these real-world applications inspired you to design and deploy tools supporting financial gains while improving operator working conditions.
As stakeholders increasingly demand corporate social responsibility (CSR) and ESG scoring, working conditions and fair wages will become key parameters of any business transformation.
Environmental, Social and Governance (ESG) is a reporting method used to disclose companies’ ecological footprint, societal impacts and governance structures.
Looking at the indicators included in the ESG score, you’ll find additional opportunities to use data science for positive change.
For more details about ESG scoring
In the following article of this series, I will focus on advanced analytics to reduce consumables usage and waste generation.
Stay tuned!
🌍 Curious about the global roadmap for a sustainable future?
Dive into my recent insights about how Data can support the United Nations’ Sustainable Development Goals.
Data Science to Support the Sustainable Development Goals (SDGs) – Data For Good
About Me
Let’s connect on LinkedIn and Twitter. I am a Supply Chain Engineer who uses data analytics to improve logistics operations and reduce costs.
For consulting or advice on analytics and sustainable supply chain transformation, feel free to contact me via Logigreen Consulting.
If interested in Data Analytics and Supply Chain, look at my website.
💌 New articles straight in your inbox for free: Newsletter
📘 Your complete guide for Supply Chain Analytics: Analytics Cheat Sheet
Share This Article
Towards Data Science is a community publication. Submit your insights to reach our global audience and earn through the TDS Author Payment Program.
Write for TDS