
Exploratory Data Analysis & Visualization in Python
I work on strategic questions and provide actionable, data-driven insights to inform product and engineering decisions. One day, I got…
In this article, I’ll use Python to explore and visualize the classic titanic data.
The focus of this analysis is to answer the question – "what are the characteristics of the titanic survivors?".
The titanic data can be downloaded from the Kaggle website. I’ll use the train.csv for data exploration, which contains the survival data needed to understand the characteristics of the titanic survivors.
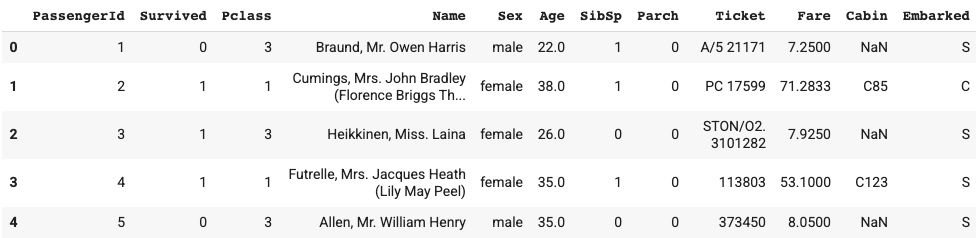
Let’s first see what the data looks like.
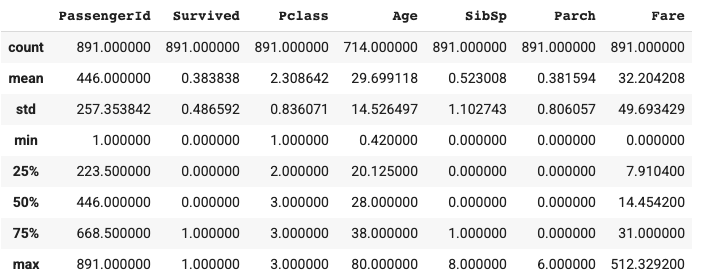
In the train data, there’re 891 passengers, and the average survival rate is 38%. Age ranges from 0.42 to 80 and the average is ~30 year old. At least 50% of passengers don’t have siblings / spouses aboard the Titanic, and at least 75% of passengers don’t have parents / children aboard the Titanic. The fare varies a lot.
Let’s change the type of Passenger Id, Survived and Pclass to string.
One thing to note for fare is that the minimum is 0. Could it be a data error?
Above is a list of passengers with $0 fare. I spot checked a few passengers to see if the $0 fare is intended.
According to www.encyclopedia-titanica.org, Mr Thomas Andrews Jr was a nephew of Lord Pirrie, principal owner of Harland & Wolff (the builders of the Titanic). He boarded with a complimentary ticket №112050.
Mr William Henry Marsh Parr was a managing electrical engineer and chosen to oversee the smooth running of the Titanic’s maiden voyage.
Mr Johan Vilhelm Henrik Törnqvist and his fellow American Line employees (William Cahoone Johnson Jr., Alfred Johnson, Lionel Leonard) were given third class accommodation aboard their Titanic to make the trip back to New York (ticket number 370160) where they could resume work.
Given this information, the $0 fare doesn’t seem to be a data error.
Passengers that share the same ticket number seem to be in the same traveling group. I can create a boolean variable for traveling group to see if people travelled in groups would be more likely to survive. This will be covered in the Feature Engineering article.
~20% of Age data is missing, 77% of Cabin data is missing, and 0.2% of Embarked data is missing. We’ll need to handle the missing data before modeling. This will be covered in the Feature Engineering article as well.
2. Numerical Variables
As to the box plots, survivors and victims have similar quartiles in Age and SibSp. Compared to victims, survivors were more likely to have parents / children aboard the Titanic and have relatively more expensive tickets.
Box plot provides a quick view of numerical data through quartiles. Let’s also check the data distribution using histograms to uncover additional patterns.
Note that when comparing the distribution of two sets of data, it’s preferred to use the relative frequency instead of the absolute frequency. Using Age as an example, the histogram with absolute frequency suggests that there were a lot more victims than survivors in the age group of 20–30. Is this true?
In the histogram of relative frequency for age, what really stands out is the age group < 10. Children were more likely to survive compared to victims among all age groups.
In the earlier step to check missing values, we found ~20% of Age data is missing. The histograms for Age above are based on non na values. Does the missing data in Age contain any useful information?
From the pie plots, we can tell that passengers with missing age were more likely to be victims. If this view of the pie plots isn’t very clear, let’s try a different way to slice the data (see below).
Regarding feature engineering for Age, I’ll probably create a categorical variable including categories for Children, Adult, Senior and Missing Values respectively.
Let’s take a look at the histograms for the four numerical variables based on the relative frequency.
3. Categorical Variables
Let’s take a quick glance at the categorical variables.
In an earlier step, we found that 77% of Cabin data is missing, and 0.2% of Embarked data is missing. I’ll replace the missing values with a placeholder ‘_n/a’ and only keep the first letter in Cabin.
Perhaps a better way to clean the Cabin data is to replace the missing values with the Cabin number from passengers that shared the same ticket number. It’ll be also interesting to look into those with multiple Cabin numbers in one field to see if there’s any meaningful pattern. I’ll save this for the feature engineering article.
After some simple cleaning of the data, we can check the survival rates in the categorical variables using the bar plots.
As to the Variable Notes at https://www.kaggle.com/c/titanic/data, pclass is a proxy for socio-economic status (SES). From the bar plots, we can see that passengers with higher SES were more likely to survive.
Additionally, women were much more likely to survive than men. Is it because the distribution of the overall passengers was skewed towards women? It’s actually the opposite. During the quick glance at the categorical variables, we saw that 65% of passengers were men and 35% were women.
Cabin has a lot of missing values, so the comparison of survival rates between different cabins may not be meaningful. I’ll revisit this after the feature engineering.
Passengers embarked at Cherbourg had a higher chance to survive than passengers embarked at Queenstown and Southampton. Passengers without a Cabin number were 100% survived but the passenger count is only two.
To summarize, here’re the characteristics of survivors compared to victims.
- Survivors were more likely to have parents / children aboard the Titanic and have relatively more expensive tickets.
- Children were more likely to survive compared to victims among all age groups.
- Passengers with missing age were less likely to be survivors.
- Passengers with higher pclass (SES) were more likely to survive.
- Women were much more likely to survive than men.
- Passengers embarked at Cherbourg had a higher chance to survive than passengers embarked at Queenstown and Southampton.
I also found that a few variables need further cleaning / transformations.
- Age: Given the useful information in age group < 10 and passengers with missing age, I’ll create a categorical variable for age to represent these categories.
- Cabin: 77% of Cabin data is missing. Some of the passengers without Cabin data may share the same ticket with passengers that had a Cabin number. I can use this as a way to recover some of the Cabin data.
- Cabin count (new feature): Some passengers had multiple Cabin numbers. There might be additional information to look into.
- Fare: Fare is positively correlated with survival. As we saw earlier, some passengers boarded with complimentary tickets. Should I do something with fare? I’ll need to think more about this.
- Traveling group (new feature): I can use ticket number to create a boolean variable for traveling group and see if people travelled in groups would be more likely to survive.
- Name: This is the only variable that I haven’t analyzed. Is there any information in name? I’ll need to think more about this.
Thanks for reading. I hope you find this article helpful. If you have any questions or suggestions, please leave a comment.
In the next article, I’ll use Python to do feature engineering on the titanic data to get ready for building the machine learning models. Please stay tuned. 🙂
Share This Article
Towards Data Science is a community publication. Submit your insights to reach our global audience and earn through the TDS Author Payment Program.
Write for TDS