👁 announcement - icon
Get up to speed with the core of Maven quickly, and then go beyond the foundations into the more powerful functionality of the build tool, such as profiles, scopes, multi-module projects and quite a bit more:
 |
VOOZH | about |
Mocking is an essential part of unit testing, and the Mockito library makes it easy to write clean and intuitive unit tests for your Java code.
Get started with mocking and improve your application tests using our Mockito guide:
Handling concurrency in an application can be a tricky process with many potential pitfalls. A solid grasp of the fundamentals will go a long way to help minimize these issues.
Get started with understanding multi-threaded applications with our Java Concurrency guide:
Spring 5 added support for reactive programming with the Spring WebFlux module, which has been improved upon ever since. Get started with the Reactor project basics and reactive programming in Spring Boot:
Since its introduction in Java 8, the Stream API has become a staple of Java development. The basic operations like iterating, filtering, mapping sequences of elements are deceptively simple to use.
But these can also be overused and fall into some common pitfalls.
To get a better understanding on how Streams work and how to combine them with other language features, check out our guide to Java Streams:
Get started with Spring and Spring Boot, through the Learn Spring course:
>> LEARN SPRINGExplore Spring Boot 3 and Spring 6 in-depth through building a full REST API with the framework:
Yes, Spring Security can be complex, from the more advanced functionality within the Core to the deep OAuth support in the framework.
I built the security material as two full courses - Core and OAuth, to get practical with these more complex scenarios. We explore when and how to use each feature and code through it on the backing project.
You can explore the course here:
Spring Data JPA is a great way to handle the complexity of JPA with the powerful simplicity of Spring Boot.
Get started with Spring Data JPA through the guided reference course:
Refactor Java code safely — and automatically — with OpenRewrite.
Refactoring big codebases by hand is slow, risky, and easy to put off. That’s where OpenRewrite comes in. The open-source framework for large-scale, automated code transformations helps teams modernize safely and consistently.
Each month, the creators and maintainers of OpenRewrite at Moderne run live, hands-on training sessions — one for newcomers and one for experienced users. You’ll see how recipes work, how to apply them across projects, and how to modernize code with confidence.
Join the next session, bring your questions, and learn how to automate the kind of work that usually eats your sprint time.
Code coverage is a software metric used to measure how many lines of our code are executed during automated tests.
In this tutorial, we’re going to stroll through some practical aspects of using JaCoCo, a code coverage reports generator for Java projects.
In order to get up and running with JaCoCo, we need to declare this maven plugin in our pom.xml file:
<plugin>
 <groupId>org.jacoco</groupId>
 <artifactId>jacoco-maven-plugin</artifactId>
 <version>0.7.7.201606060606</version>
 <executions>
 <execution>
 <goals>
 <goal>prepare-agent</goal>
 </goals>
 </execution>
 <execution>
 <id>report</id>
 <phase>prepare-package</phase>
 <goals>
 <goal>report</goal>
 </goals>
 </execution>
 </executions>
</plugin>
The link provided here will always go to the latest version of the plugin in the maven central repository.
Before we start looking at JaCoCo’s code coverage capabilities, we need to have a code sample. Here’s a simple Java function that checks whether a string reads the same backward and forward:
public boolean isPalindrome(String inputString) {
 if (inputString.length() == 0) {
 return true;
 } else {
 char firstChar = inputString.charAt(0);
 char lastChar = inputString.charAt(inputString.length() - 1);
 String mid = inputString.substring(1, inputString.length() - 1);
 return (firstChar == lastChar) && isPalindrome(mid);
 }
}
Now all we need is a simple JUnit test:
@Test
public void whenEmptyString_thenAccept() {
 Palindrome palindromeTester = new Palindrome();
 assertTrue(palindromeTester.isPalindrome(""));
}
Running the test using JUnit will automatically set in motion the JaCoCo agent. It will create a coverage report in binary format in the target directory, target/jacoco.exec.
Obviously we can’t interpret the output single-handedly, but other tools and plugins can, e.g. Sonar Qube.
The good news is that we can use the jacoco:report goal in order to generate readable code coverage reports in several formats, like HTML, CSV, and XML.
For example, now we can take a look at the target/site/jacoco/index.html page to see what the generated report looks like:
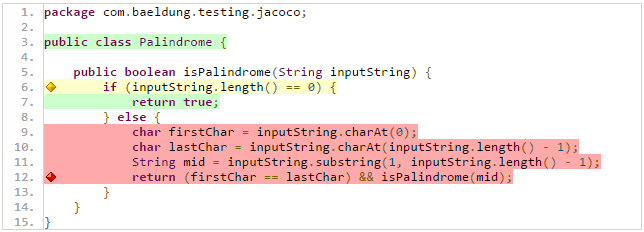
👁 coverageFollowing the link provided in the report, Palindrome.java , we can drill through a more detailed view for each Java class:
👁 palindrometest1-1Note that we can straightforwardly manage code coverage using JaCoCo inside Eclipse with zero configuration, thanks to the EclEmma Eclipse plugin.
Our report shows 21% instructions coverage, 17% branches coverage, 3/5 for cyclomatic complexity, and so on.
The 38 instructions shown by JaCoCo in the report refer to the byte code instructions, as opposed to ordinary Java code instructions.
JaCoCo reports help us visually analyze code coverage by using diamonds with colors for branches, and background colors for lines:
The same color code applies to the background color, but for lines coverage.
JaCoCo mainly provides three important metrics:
To take a trivial example, if there are no if or switch statements in the code, the cyclomatic complexity will be 1, as we only need one execution path to cover the entire code.
Generally, the cyclomatic complexity reflects the number of test cases we need to implement in order to cover the entire code.
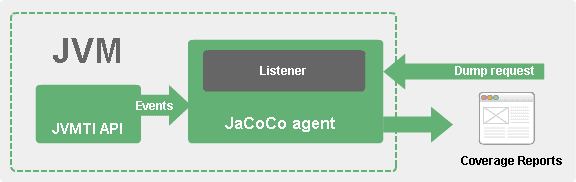
JaCoCo runs as a Java agent. It’s responsible for instrumenting the byte code while running the tests. JaCoCo drills into each instruction, and shows which lines are exercised during each test.
To gather coverage data, JaCoCo uses ASM for code instrumentation on the fly, receiving events from the JVM Tool Interface in the process:
👁 jacoco conceptIt’s also possible to run the JaCoCo agent in server mode. In this case, we can run our tests with jacoco:dump as a goal in order to initiate a dump request.
We can follow the official documentation link for more in-depth details about JaCoCo design.
Now that we know a bit about how JaCoCo works, let’s improve our code coverage score.
In order to achieve 100% code coverage, we need to introduce tests that cover the missing parts shown in the initial report:
@Test
public void whenPalindrom_thenAccept() {
Palindrome palindromeTester = new Palindrome();
assertTrue(palindromeTester.isPalindrome("noon"));
}
@Test
public void whenNearPalindrom_thenReject(){
Palindrome palindromeTester = new Palindrome();
assertFalse(palindromeTester.isPalindrome("neon"));
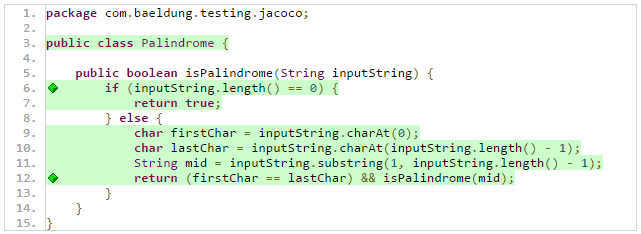
}Now we have enough tests to cover our the entire code, but to make sure of that, let’s run the Maven command mvn jacoco:report to publish the coverage report:
👁 coverageAs we can see, all the lines/branches/paths in our code are fully covered:
👁 coverageIn a real world project, as developments go further, we need to keep track of the code coverage score.
JaCoCo offers a simple way of declaring minimum requirements that should be met, otherwise the build will fail.
We can do that by adding the following check goal in our pom.xml file:
<execution>
 <id>jacoco-check</id>
 <goals>
 <goal>check</goal>
 </goals>
 <configuration>
 <rules>
 <rule>
 <element>PACKAGE</element>
 <limits>
 <limit>
 <counter>LINE</counter>
 <value>COVEREDRATIO</value>
 <minimum>0.50</minimum>
 </limit>
 </limits>
 </rule>
 </rules>
 </configuration>
</execution>
As we can see, we’re limiting the minimum score for lines coverage to 50%.
The jacoco:check goal is bound to verify, so we can run the Maven command mvn clean verify to check whether the rules are respected or not. The logs will show something like:
[ERROR] Failed to execute goal org.jacoco:jacoco-maven-plugin:0.7.7.201606060606:check
(jacoco-check) on project mutation-testing: Coverage checks have not been met.In this article, we learned how to make use of the JaCoCo maven plugin to generate code coverage reports for Java projects.
Keep in mind though, 100% code coverage doesn’t necessarily reflect effective testing, as it only reflects the amount of code exercised during tests. In a previous article, we talked about mutation testing as a more sophisticated way to track the effectiveness of tests compared to ordinary code coverage.
Baeldung Pro comes with both absolutely No-Ads as well as finally with Dark Mode, for a clean learning experience:
Once the early-adopter seats are all used, the price will go up and stay at $33/year.
The Apache HTTP Client is a very robust library, suitable for both simple and advanced use cases when testing HTTP endpoints. Check out our guide covering basic request and response handling, as well as security, cookies, timeouts, and more:
Handling concurrency in an application can be a tricky process with many potential pitfalls. A solid grasp of the fundamentals will go a long way to help minimize these issues.
Get started with understanding multi-threaded applications with our Java Concurrency guide:
Since its introduction in Java 8, the Stream API has become a staple of Java development. The basic operations like iterating, filtering, mapping sequences of elements are deceptively simple to use.
But these can also be overused and fall into some common pitfalls.
To get a better understanding on how Streams work and how to combine them with other language features, check out our guide to Java Streams:
Get started with Spring Boot and with core Spring, through the Learn Spring course:
Modern Java teams move fast — but codebases don’t always keep up. Frameworks change, dependencies drift, and tech debt builds until it starts to drag on delivery. OpenRewrite was built to fix that: an open-source refactoring engine that automates repetitive code changes while keeping developer intent intact.
The monthly training series, led by the creators and maintainers of OpenRewrite at Moderne, walks through real-world migrations and modernization patterns. Whether you’re new to recipes or ready to write your own, you’ll learn practical ways to refactor safely and at scale.
If you’ve ever wished refactoring felt as natural — and as fast — as writing code, this is a good place to start.