
eBook – Guide Spring Cloud – NPI EA (cat=Spring Cloud)
eBook – Mockito – NPI EA (tag = Mockito)
👁 announcement - icon
Mocking is an essential part of unit testing, and the Mockito library makes it easy to write clean and intuitive unit tests for your Java code.
Get started with mocking and improve your application tests using our Mockito guide:
eBook – Java Concurrency – NPI EA (cat=Java Concurrency)
👁 announcement - icon
Handling concurrency in an application can be a tricky process with many potential pitfalls. A solid grasp of the fundamentals will go a long way to help minimize these issues.
Get started with understanding multi-threaded applications with our Java Concurrency guide:
eBook – Reactive – NPI EA (cat=Reactive)
👁 announcement - icon
Spring 5 added support for reactive programming with the Spring WebFlux module, which has been improved upon ever since. Get started with the Reactor project basics and reactive programming in Spring Boot:
eBook – Java Streams – NPI EA (cat=Java Streams)
👁 announcement - icon
Since its introduction in Java 8, the Stream API has become a staple of Java development. The basic operations like iterating, filtering, mapping sequences of elements are deceptively simple to use.
But these can also be overused and fall into some common pitfalls.
To get a better understanding on how Streams work and how to combine them with other language features, check out our guide to Java Streams:
eBook – Jackson – NPI EA (cat=Jackson)
eBook – HTTP Client – NPI EA (cat=Http Client-Side)
eBook – Maven – NPI EA (cat = Maven)
eBook – Persistence – NPI EA (cat=Persistence)
eBook – RwS – NPI EA (cat=Spring MVC)
Course – LS – NPI EA (cat=Jackson)
👁 announcement - icon
Get started with Spring and Spring Boot, through the Learn Spring course:
>> LEARN SPRINGCourse – RWSB – NPI EA (cat=REST)
👁 announcement - icon
Explore Spring Boot 3 and Spring 6 in-depth through building a full REST API with the framework:
Course – LSS – NPI EA (cat=Spring Security)
👁 announcement - icon
Yes, Spring Security can be complex, from the more advanced functionality within the Core to the deep OAuth support in the framework.
I built the security material as two full courses - Core and OAuth, to get practical with these more complex scenarios. We explore when and how to use each feature and code through it on the backing project.
You can explore the course here:
Course – LSD – NPI EA (tag=Spring Data JPA)
👁 announcement - icon
Spring Data JPA is a great way to handle the complexity of JPA with the powerful simplicity of Spring Boot.
Get started with Spring Data JPA through the guided reference course:
Partner – Moderne – NPI EA (cat=Spring Boot)
👁 announcement - icon
Refactor Java code safely — and automatically — with OpenRewrite.
Refactoring big codebases by hand is slow, risky, and easy to put off. That’s where OpenRewrite comes in. The open-source framework for large-scale, automated code transformations helps teams modernize safely and consistently.
Each month, the creators and maintainers of OpenRewrite at Moderne run live, hands-on training sessions — one for newcomers and one for experienced users. You’ll see how recipes work, how to apply them across projects, and how to modernize code with confidence.
Join the next session, bring your questions, and learn how to automate the kind of work that usually eats your sprint time.
Course – LJB – NPI EA (cat = Core Java)
1. Overview
In this article, we are going to add Zipkin to our spring cloud project. Zipkin is an open-source project that provides mechanisms for sending, receiving, storing, and visualizing traces. This allows us to correlate activity between servers and get a much clearer picture of exactly what is happening in our services.
This article is not an introductory article to distributed tracing or spring cloud. If you would like more information about distributed tracing, read our introduction to spring sleuth.
Note: Zipkin project has deprecated the custom server. It is no longer possible to run a custom Zipkin server compatible with Spring Cloud or Spring Boot. The best approach to run a Zipkin server is inside a docker container.
In section 2, we describe how to setup Zipkin for a custom server build (deprecated)
In section 3, we describe the preferable default server build, setup, services configuration, and run process.
2. Zipkin Service With Custom Server Build
Our Zipkin service will serve as the store for all our spans. Each span is sent to this service and collected into traces for future identification.
2.1. Setup
We create a new Spring Boot project and add these dependencies to pom.xml:
<dependency>
 <groupId>io.zipkin.java</groupId>
 <artifactId>zipkin-server</artifactId>
</dependency>
<dependency>
 <groupId>io.zipkin.java</groupId>
 <artifactId>zipkin-autoconfigure-ui</artifactId>
 <scope>runtime</scope>
</dependency>
For reference: we can find the latest version on Maven Central (zipkin-server, zipkin-autoconfigure-ui). Versions of the dependencies are inherited from spring-boot-starter-parent.
2.2. Enabling Zipkin Server
To enable the Zipkin server, we must add some annotations to the main application class:
@SpringBootApplication
@EnableZipkinServer
public class ZipkinApplication {...}
The new annotation @EnableZipkinServer will set up this server to listen for incoming spans and act as our UI for querying.
2.3. Configuration
First, let’s create a file called bootstrap.properties in src/main/resources. Remember that this file is needed to fetch our configuration from the config server.
Let’s add these properties to it:
spring.cloud.config.name=zipkin
spring.cloud.config.discovery.service-id=config
spring.cloud.config.discovery.enabled=true
spring.cloud.config.username=configUser
spring.cloud.config.password=configPassword

eureka.client.serviceUrl.defaultZone=
 http://discUser:discPassword@localhost:8082/eureka/
Now let’s add a configuration file to our config repo, located at c:\Users\{username}\ on Windows or /home/{username}/ on *nix.
In this directory let’s add a file named zipkin.properties and add these contents:
spring.application.name=zipkin
server.port=9411
eureka.client.region=default
eureka.client.registryFetchIntervalSeconds=5
logging.level.org.springframework.web=debug
Remember to commit the changes in this directory so that the config service will detect the changes and load the file.
2.4. Run
Now let’s run our application and navigate to http://localhost:9411. We should be greeted with Zipkin’s homepage:
👁 zipkinhomepage 1
Great! Now we are ready to add some dependencies and configurations to our services that we want to trace.
2.5. Services Configuration
The setup for the resource servers is pretty simple. In the following sections, we will detail how to set up the book-service. After that, we can configure the same for the rating-service and gateway-service.
2.5.1. Setup
To begin sending spans to our Zipkin server, we will add this dependency to our pom.xml file:
<dependency>
 <groupId>org.springframework.boot</groupId>
 <artifactId>spring-boot-starter-actuator</artifactId>
</dependency>
<dependency>
 <groupId>io.zipkin.reporter2</groupId>
 <artifactId>zipkin-reporter-brave</artifactId>
</dependency>
<dependency>
 <groupId>io.micrometer</groupId>
 <artifactId>micrometer-tracing-bridge-brave</artifactId>
</dependency>
2.5.3. Configuration
Now let’s add some configuration to our book-service.properties file in the config repository:
management.tracing.sampling.probability=1Zipkin works by sampling actions on a server. By setting the management.tracing.sampling.probability to 1, we are setting the sampling rate to 100%.
3. Configuration With Default Server Build
As already stated, this is the suggested way to run Zipkin.
3.1. Zipkin Module Setup
In your IDE project, create a “Zipkin” folder and add a docker-compose.yml file with the contents:
version: "3.9"

services:

zipkin:

image: openzipkin/zipkin

ports:

- 9411:9411
Alternatively, check the official documentation here
3.2. Service Configuration
Service configuration is the same as in section 2.5 above.
3.3. Run
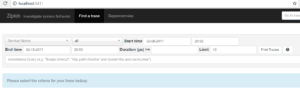
First, we start the Redis server, config, discovery, gateway, book, rating, and Zipkin docker image with “docker compose up -d“. Then we navigate to http://localhost:8080/book-service/books address. After that, we open a new tab and navigate to http://localhost:9411. On this page, we select book-service and press the ‘Find Traces’ button. We should see a trace appear in the search results. Finally, we can click that trace of opening it:
👁 zipkintrace 1
On the trace page, we can see the request broken down by service. The first two spans are created by the gateway, and the last is created by the book-service. This shows us how much time the request spent processing on the book-service, 18.379 ms, and on the gateway, 87.961 ms.
4. Conclusion
We have seen how easy it is to integrate Zipkin into our cloud application.
This gives us some much-needed insight into how communication travels through our application. As our application grows in complexity, Zipkin can provide us with much-needed information on where requests are spending their time. This can help us determine where things are slowing down and indicate what areas of our application need improvement.
The code backing this article is available on GitHub. Once you're logged in as a Baeldung Pro Member, start learning and coding on the project.