
Analyze and Interpret Data Using Excel
Keep adding new skills with 10,000+ programs for $239 (usually $399). Save now.
Analyze and Interpret Data Using Excel
This course is part of Advanced Excel Analytics, Automation & Data Analysis Specialization
Included with
Ask Coursera
11 reviews
Recommended experience
11 reviews
Recommended experience
What you'll learn
Activate Excel analytical tools and compute descriptive statistics to summarize and explore datasets.
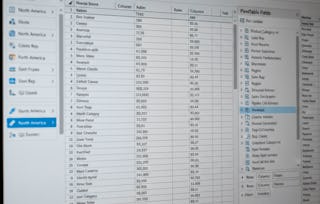
Visualize data relationships and run correlation and regression analyses using Excel and the Analysis Toolpak.
Interpret statistical outputs to support informed, data-driven business and research decisions.
Skills you'll gain
- Data Analysis
- Scatter Plots
- Plot (Graphics)
- Statistical Modeling
- Descriptive Analytics
- Analytics
- Regression Analysis
- Statistical Analysis
- Statistical Visualization
- Statistics
- Spreadsheet Software
- Exploratory Data Analysis
- Statistical Methods
- Correlation Analysis
- Excel Formulas
- Analysis
- Descriptive Statistics
- Predictive Modeling
- Trend Analysis
Tools you'll learn
Details to know
December 2025
7 assignments
See how employees at top companies are mastering in-demand skills
Build your subject-matter expertise
- Learn new concepts from industry experts
- Gain a foundational understanding of a subject or tool
- Develop job-relevant skills with hands-on projects
- Earn a shareable career certificate
There are 2 modules in this course
Learners will be able to activate Excel’s analytical tools, compute descriptive statistics, visualize data relationships, run regression models, and interpret statistical outputs to make informed, data-driven decisions. This course equips participants with the practical skills needed to analyze real-world datasets using Excel’s built-in functions and the Analysis Toolpak.
Through a step-by-step, application-focused approach, learners gain hands-on experience generating summary measures, exploring correlations, creating scatter plots, and executing linear regression. Each module progresses from foundational skills to advanced analytical techniques, ensuring that learners build confidence as they move from basic data preparation to interpreting statistical models. What makes this course unique is its clear, practice-oriented structure that mirrors real workplace analytical tasks. Instead of abstract theory, every video, exercise, and lesson is designed to help learners apply Excel’s statistical capabilities immediately and accurately. By the end of the course, learners will not only understand the underlying concepts but will also be able to perform professional-quality data analysis, making them better prepared for roles in business, research, finance, and data-driven decision-making.
This module introduces learners to the foundational tools and techniques for performing descriptive statistics in Excel, including activating analytical add-ins, calculating summary measures using formulas, and exploring variable relationships through correlation. Learners gain essential skills for preparing, analyzing, and interpreting data using Excel’s built-in statistical capabilities.
What's included
7 videos4 assignments
7 videos•Total 73 minutes
- Installing Data Analysis add-ins in MS Excel•8 minutes
- Generating Descriptive Using Analysis Toolach add-ins•11 minutes
- Generating Descriptive Using Statistical Formulae•11 minutes
- Generating Descriptive Using Statistical Formulae Continued•7 minutes
- Interpretation of Descriptive•6 minutes
- Generating Correlations using MS Excel Formulae•16 minutes
- Using MS Analysis Toolach add-in•14 minutes
4 assignments•Total 60 minutes
- Getting Started with Excel’s Analytical Tools•10 minutes
- Descriptive Statistics the Manual Way•10 minutes
- Exploring Variable Relationships•10 minutes
- Mastering Descriptive Statistics in Excel•30 minutes
This module equips learners with essential visualization and analytical techniques to uncover insights from data using Excel. Through scatter plots, trend analysis, regression modeling, and output interpretation, learners develop the ability to visualize relationships, build predictive models, and make meaningful data-driven conclusions.
What's included
5 videos3 assignments
5 videos•Total 51 minutes
- Generating Scatter Plots for the Variables•14 minutes
- Linear Regression Theory•11 minutes
- Generating Regression Output•12 minutes
- Generating Scatter Plot•9 minutes
- Inter Predation of Estimates and Outputs•5 minutes
3 assignments•Total 50 minutes
- Visualizing Data for Insights•10 minutes
- Running and Interpreting Regression Models in Excel•10 minutes
- Data Visualization & Regression Techniques•30 minutes
Earn a career certificate
Add this credential to your LinkedIn profile, resume, or CV. Share it on social media and in your performance review.
Explore more from Data Analysis
- Status: Free Trial
Course
- Status: PreviewC
Coursera
Course
- Status: Free Trial
Course
- Status: Free TrialL
Logical Operations
Course
Why people choose Coursera for their career
Learner reviews
- 5 stars
100%
- 4 stars
0%
- 3 stars
0%
- 2 stars
0%
- 1 star
0%
Showing 3 of 11
Reviewed on Mar 24, 2026
This course teaches basic data analysis and statistics using Excel tools.
Reviewed on Jun 9, 2026
Very useful course, content is well explained and easy to understand.
Reviewed on Apr 7, 2026
Good for beginners who want to learn data interpretation in Excel.
Frequently asked questions
To access the course materials, assignments and to earn a Certificate, you will need to purchase the Certificate experience when you enroll in a course. You can try a Free Trial instead, or apply for Financial Aid. The course may offer 'Full Course, No Certificate' instead. This option lets you see all course materials, submit required assessments, and get a final grade. This also means that you will not be able to purchase a Certificate experience.
When you enroll in the course, you get access to all of the courses in the Specialization, and you earn a certificate when you complete the work. Your electronic Certificate will be added to your Accomplishments page - from there, you can print your Certificate or add it to your LinkedIn profile.
Yes. In select learning programs, you can apply for financial aid or a scholarship if you can’t afford the enrollment fee. If fin aid or scholarship is available for your learning program selection, you’ll find a link to apply on the description page.
More questions
Financial aid available,