
Analyze Predictor Impact Using Regression in Minitab
Keep adding new skills with 10,000+ programs for $239 (usually $399). Save now.
Analyze Predictor Impact Using Regression in Minitab
This course is part of Minitab Applied Statistics & Hypothesis Testing Mastery Specialization
Included with
Ask Coursera
Recommended experience
Recommended experience
What you'll learn
Analyze how multiple predictors influence a response using regression models.
Interpret and compare regression outputs in Minitab for model selection.
Translate statistical results into actionable business insights.
Details to know
February 2026
6 assignments
See how employees at top companies are mastering in-demand skills
Build your subject-matter expertise
- Learn new concepts from industry experts
- Gain a foundational understanding of a subject or tool
- Develop job-relevant skills with hands-on projects
- Earn a shareable career certificate
There are 2 modules in this course
By the end of this course, learners will be able to analyze how multiple predictors influence a response variable, interpret regression outputs using Minitab, compare alternative regression models, and translate statistical findings into actionable business insights. Learners will develop the ability to evaluate predictor significance, visualize relationships, and select appropriate regression models to support data-driven decision-making.
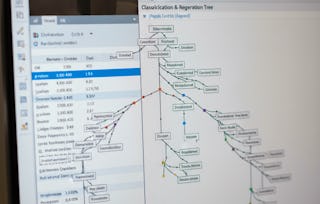
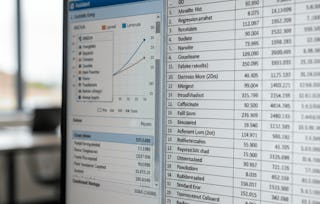
This course provides a practical, hands-on approach to regression analysis through a real-world Tech Mahindra case study. Rather than focusing on theory alone, learners work step-by-step through an end-to-end analytics project—starting from problem framing and exploratory analysis to model refinement and comparison. Using Minitab, learners gain experience interpreting regression coefficients, p-values, and visual diagnostics such as scatter plots to understand predictor–response relationships. What makes this course unique is its strong business orientation and project-based structure. Learners not only build and compare linear and quadratic regression models but also learn how to justify model choices based on both statistical performance and business relevance. This course is ideal for professionals and students seeking to strengthen applied regression skills and confidently use Minitab for real-world analytical challenges.
This module introduces learners to a real-world regression project using Minitab, focusing on clearly defining the business problem, identifying response and predictor variables, and building an initial regression model. Through the Tech Mahindra case study, learners explore how statistical analysis connects to business decision-making using exploratory data analysis, regression output interpretation, and visualization techniques.
What's included
5 videos3 assignments
5 videos•Total 44 minutes
- Introduction to Project•8 minutes
- Case Study - Tech Mahindra•6 minutes
- Regression Model and Output - Tech Mahindra•10 minutes
- Scatter Plot - Tech Mahindra•11 minutes
- Case Study - Tech Mahindra 1•8 minutes
3 assignments•Total 50 minutes
- Framing the Business Problem with Regression•30 minutes
- Project Context & Business Case•10 minutes
- Building and Visualizing the Initial Regression Model•10 minutes
This module guides learners through refining regression models by reassessing predictors, validating assumptions, and comparing alternative model forms. Using advanced iterations of the Tech Mahindra case study, learners evaluate linear and quadratic regression models, apply visual and statistical comparison techniques, and select models that balance analytical accuracy with business interpretability.
What's included
5 videos3 assignments
5 videos•Total 39 minutes
- Case Study - Tech Mahindra 2•6 minutes
- Case Study - Tech Mahindra 3•7 minutes
- Case Study - Tech Mahindra 4•9 minutes
- Comparison of Linear and Quadratic Regression Models•8 minutes
- Comparison with Scatter Plots•9 minutes
3 assignments•Total 50 minutes
- Model Refinement and Comparative Analysis•30 minutes
- Exploring Predictor–Response Relationships•10 minutes
- Comparing Regression Models for Better Decisions•10 minutes
Earn a career certificate
Add this credential to your LinkedIn profile, resume, or CV. Share it on social media and in your performance review.
Explore more from Data Analysis
- Status: Free Trial
- Status: Free Trial
- Status: Free Trial
Course
- Status: Free Trial
Course
Why people choose Coursera for their career
Frequently asked questions
To access the course materials, assignments and to earn a Certificate, you will need to purchase the Certificate experience when you enroll in a course. You can try a Free Trial instead, or apply for Financial Aid. The course may offer 'Full Course, No Certificate' instead. This option lets you see all course materials, submit required assessments, and get a final grade. This also means that you will not be able to purchase a Certificate experience.
When you enroll in the course, you get access to all of the courses in the Specialization, and you earn a certificate when you complete the work. Your electronic Certificate will be added to your Accomplishments page - from there, you can print your Certificate or add it to your LinkedIn profile.
Yes. In select learning programs, you can apply for financial aid or a scholarship if you can’t afford the enrollment fee. If fin aid or scholarship is available for your learning program selection, you’ll find a link to apply on the description page.
More questions
Financial aid available,