
Linear Regression and Modeling
Keep adding new skills with 10,000+ programs for $239 (usually $399). Save now.
Linear Regression and Modeling
This course is part of Data Analysis with R Specialization
Instructor: Mine Çetinkaya-Rundel
104,464 already enrolled
Included with
Ask Coursera
1,787 reviews
1,787 reviews
Skills you'll gain
Tools you'll learn
Details to know
See how employees at top companies are mastering in-demand skills
Build your subject-matter expertise
- Learn new concepts from industry experts
- Gain a foundational understanding of a subject or tool
- Develop job-relevant skills with hands-on projects
- Earn a shareable career certificate
There are 4 modules in this course
This course introduces simple and multiple linear regression models. These models allow you to assess the relationship between variables in a data set and a continuous response variable. Is there a relationship between the physical attractiveness of a professor and their student evaluation scores? Can we predict the test score for a child based on certain characteristics of his or her mother? In this course, you will learn the fundamental theory behind linear regression and, through data examples, learn to fit, examine, and utilize regression models to examine relationships between multiple variables, using the free statistical software R and RStudio.
This short module introduces basics about Coursera specializations and courses in general, this specialization: Statistics with R, and this course: Linear Regression and Modeling. Please take several minutes to browse them through. Thanks for joining us in this course!
What's included
1 video3 readings
1 video•Total 2 minutes
- Introduction to Statistics with R•2 minutes
3 readings•Total 25 minutes
- About Statistics with R Specialization•10 minutes
- More about Linear Regression and Modeling•10 minutes
- Report a problem with the course•5 minutes
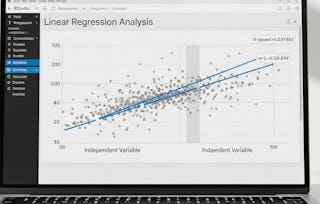
In this week we’ll introduce linear regression. Many of you may be familiar with regression from reading the news, where graphs with straight lines are overlaid on scatterplots. Linear models can be used for prediction or to evaluate whether there is a linear relationship between two numerical variables.
What's included
8 videos3 readings2 assignments
8 videos•Total 47 minutes
- Introduction•1 minute
- Correlation•9 minutes
- Residuals•2 minutes
- Least Squares Line•12 minutes
- Prediction and Extrapolation•4 minutes
- Conditions for Linear Regression•10 minutes
- R Squared•4 minutes
- Regression with Categorical Explanatory Variables•6 minutes
3 readings•Total 30 minutes
- Lesson Learning Objectives•10 minutes
- Lesson Learning Objectives•10 minutes
- Week 1 Suggested Readings and Practice•10 minutes
2 assignments•Total 48 minutes
- Week 1 Quiz•18 minutes
- Week 1 Practice Quiz•30 minutes
Welcome to week 2! In this week, we will look at outliers, inference in linear regression and variability partitioning. Please use this week to strengthen your understanding on linear regression. Don't forget to post your questions, concerns and suggestions in the discussion forum!
What's included
3 videos5 readings3 assignments
3 videos•Total 24 minutes
- Outliers in Regression•7 minutes
- Inference for Linear Regression•12 minutes
- Variability Partitioning•6 minutes
5 readings•Total 50 minutes
- Lesson Learning Objectives•10 minutes
- Week 2 Suggested Readings and Exercises•10 minutes
- About Lab Choices•10 minutes
- Week 1 & 2 Lab Instructions (RStudio)•10 minutes
- Week 1 & 2 Lab Instructions (RStudio Cloud)•10 minutes
3 assignments•Total 90 minutes
- Week 2 Quiz•30 minutes
- Week 1 & 2 Lab•30 minutes
- Week 2 Practice Quiz•30 minutes
In this week, we’ll explore multiple regression, which allows us to model numerical response variables using multiple predictors (numerical and categorical). We will also cover inference for multiple linear regression, model selection, and model diagnostics. There is also a final project included in this week. You will use the data set provided to complete and report on a data analysis question. Please read the project instructions to complete this self-assessment.
What's included
7 videos7 readings3 assignments
7 videos•Total 57 minutes
- Introduction•2 minutes
- Multiple Predictors•11 minutes
- Adjusted R Squared•10 minutes
- Collinearity and Parsimony•4 minutes
- Inference for MLR•12 minutes
- Model Selection•11 minutes
- Diagnostics for MLR•7 minutes
7 readings•Total 180 minutes
- Lesson Learning Objectives•10 minutes
- Lesson Learning Objectives•10 minutes
- Week 3 Suggested Readings and Exercises•10 minutes
- Week 3 Lab Instructions (RStudio)•10 minutes
- Week 3 Lab Instructions (RStudio Cloud)•10 minutes
- Project Instructions, Data files, and Checklist •120 minutes
- Share your learning experience•10 minutes
3 assignments•Total 80 minutes
- Week 3 Quiz•20 minutes
- Week 3 Lab•30 minutes
- Week 3 Practice Quiz•30 minutes
Earn a career certificate
Add this credential to your LinkedIn profile, resume, or CV. Share it on social media and in your performance review.
Instructor
Offered by
Explore more from Data Analysis
- Status: Free TrialJ
Johns Hopkins University
Course
- Status: Free TrialI
Illinois Tech
Course
- Status: Free TrialU
University of Michigan
Course
- Status: Free Trial
Course
Why people choose Coursera for their career
Learner reviews
- 5 stars
80.47%
- 4 stars
15.83%
- 3 stars
2.90%
- 2 stars
0.27%
- 1 star
0.50%
Showing 3 of 1787
Reviewed on Jan 19, 2018
Good but I felt some gaps in the material made it difficult to learn. Also, the quiz questions are focused on attention to detail "gotcha" questions. This can be frustrating.
Reviewed on Feb 25, 2017
Good, but a little "smaller" than the Inferential statistics course (which is very complete). I would have liked to also learn Logistics regression, which I now have to learn elsewhere.
Reviewed on May 14, 2020
It has been a great adventure so far. I still greatly appreciate how final projects are constructed that gives us freedom to choose our approach to the problems within the data set.
Frequently asked questions
No. Completion of a Coursera course does not earn you academic credit from Duke; therefore, Duke is not able to provide you with a university transcript. However, your electronic Certificate will be added to your Accomplishments page - from there, you can print your Certificate or add it to your LinkedIn profile.
To access the course materials, assignments and to earn a Certificate, you will need to purchase the Certificate experience when you enroll in a course. You can try a Free Trial instead, or apply for Financial Aid. The course may offer 'Full Course, No Certificate' instead. This option lets you see all course materials, submit required assessments, and get a final grade. This also means that you will not be able to purchase a Certificate experience.
When you enroll in the course, you get access to all of the courses in the Specialization, and you earn a certificate when you complete the work. Your electronic Certificate will be added to your Accomplishments page - from there, you can print your Certificate or add it to your LinkedIn profile.
More questions
Financial aid available,