
Statistics Foundations
Keep adding new skills with 10,000+ programs for $239 (usually $399). Save now.
Statistics Foundations
This course is part of multiple programs.
Instructor: Brandi Robinson
48,229 already enrolled
Included with
Ask Coursera
399 reviews
Recommended experience
399 reviews
Recommended experience
What you'll learn
The basic principles of descriptive and inferential statistics
Use statistical analyses to make data-driven decisions
How to formulate and test hypotheses and take action based on the outcome
Skills you'll gain
- Analytics
- Descriptive Statistics
- Time Series Analysis and Forecasting
- Descriptive Analytics
- Statistics
- Statistical Modeling
- Statistical Inference
- Marketing Analytics
- Spreadsheet Software
- Sampling (Statistics)
- Probability & Statistics
- Regression Analysis
- Tableau Software
- Statistical Methods
- Data Modeling
- Bayesian Statistics
- Statistical Analysis
- Data Analysis
- Statistical Hypothesis Testing
Tools you'll learn
Details to know
See how employees at top companies are mastering in-demand skills
Build your subject-matter expertise
- Learn new concepts from industry experts
- Gain a foundational understanding of a subject or tool
- Develop job-relevant skills with hands-on projects
- Earn a shareable career certificate
There are 5 modules in this course
This course takes a deep dive into the statistical foundation upon which data analytics is built. The first part of this course will help you to thoroughly understand your dataset and what the data actually means. Then, it will go into sampling including how to ask specific questions about your data and how to conduct analysis to answer those questions.
Many of the mistakes made by data analysts today are due to a lack of understanding the concepts behind the tests they run, leading to incorrect tests or misinterpreting the results. This course is tailored to provide you with the necessary background knowledge to comprehend the "what" and "why" of your actions in a practical sense. By the end of this course you will be able to: • Understand the concept of dependent and independent variables • Identify variables to test • Understand the Null Hypothesis, P-Values, and their role in testing hypotheses • Formulate a hypothesis and align it to business goals • Identify actions based on hypothesis validation/invalidation • Explain Descriptive Statistics (mean, median, standard deviation, distribution) and their use cases • Understand basic concepts from Inferential Statistics • Explain the different levels of analytics (descriptive, predictive, prescriptive) in the context of marketing • Create basic statistical models for regression using data • Create time-series forecasts using historical data and basic statistical models • Understand the basic assumptions, use cases, and limitations of Linear Regression • Fit a linear regression model to a dataset and interpret the output using Tableau • Explain the difference between linear and multivariate regression • Run a segmentation (cluster) analysis • Describe the difference between observational methods and experiments This course is designed for people who want to learn the basics of descriptive and inferential statistics.
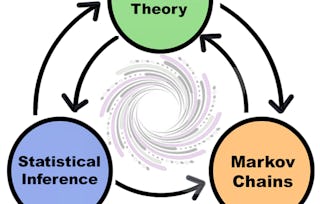
This week you’ll get an overview of the Statistics for Marketing course and you will learn the basics of Descriptive Statistics and when to use them. You will also be introduced to Bayesian statistics. You will also get an overview of your capstone project and at the end of the week you will complete part one.
What's included
20 videos7 readings5 assignments
20 videos•Total 72 minutes
- Introduction to the Program•6 minutes
- Introduction to Statistics Foundations•2 minutes
- Introduction to Speaker•2 minutes
- Careers in Marketing and Marketing Analytics•4 minutes
- Capstone Introduction•2 minutes
- Introduction: Measures of Central Tendency•1 minute
- Using Measures of Central Tendency to Find the Middle•5 minutes
- When to Use Different Measures of Central Tendency•4 minutes
- Finding the Middle with Spreadsheets•5 minutes
- Introduction: Measures of Spread•1 minute
- Variance and Range in Data Analytics•5 minutes
- Standard Deviation in Data Analytics•3 minutes
- Using Z-Scores to Judge a Value•6 minutes
- Standard Deviation in Spreadsheets•3 minutes
- Introduction: Frequency Tables•1 minute
- Frequency Tables in Marketing Analytics•3 minutes
- How to Use Contingency Tables•3 minutes
- Conditional Probability: Bayesian Statistics•5 minutes
- Understanding Scatter Plots and Correlation•9 minutes
- Week 1 Review•1 minute
7 readings•Total 75 minutes
- Statistics for Marketing Course Syllabus•10 minutes
- Join the Meta Marketing Analytics Community or the Meta Data Analyst Community!•10 minutes
- How to be Successful in this Program•10 minutes
- Community Guidelines•10 minutes
- Measures of Central Tendency Review•10 minutes
- Measures of Spread Review•10 minutes
- Frequency, Contingency, and Scatterplots Review•15 minutes
5 assignments•Total 185 minutes
- Review Your Community Knowledge•10 minutes
- Practice Quiz: Measures of Central Tendency•40 minutes
- Practice Quiz: Measures of Spread•35 minutes
- Capstone Module 1: Getting to Know the Data•60 minutes
- Graded Quiz: Descriptive Statistics•40 minutes
This week you will be introduced to inferential statistics and how to define samples and populations for marketing. You’ll also be introduced to the concept of variables. At the end of the week you will complete part two of your capstone project.
What's included
14 videos4 readings5 assignments
14 videos•Total 45 minutes
- Introduction: Sampling•1 minute
- Why Use Sampling?•4 minutes
- Sample Size in Statistics•3 minutes
- Practical Sampling Techniques•5 minutes
- Introduction: Distributions•1 minute
- Finding a Distribution•4 minutes
- Finding a Distribution in a Spreadsheet•2 minutes
- Common Distributions in Data Analytics•9 minutes
- Data Shapes•5 minutes
- Introduction: Variable Types•2 minutes
- Quantitative Variables•3 minutes
- Qualitative Variables•2 minutes
- Independent and Dependent Variables•3 minutes
- Week 2 Review•1 minute
4 readings•Total 45 minutes
- Sampling Review•10 minutes
- Reshaping Data with Transformations•10 minutes
- Distribution Review•15 minutes
- Variable Types Review•10 minutes
5 assignments•Total 195 minutes
- Practice Quiz: Sampling•25 minutes
- Practice Quiz: Distributions•30 minutes
- Practice Quiz: Variable Types•35 minutes
- Capstone Module 2: Understanding Your Data Samples•60 minutes
- Graded Quiz: Sampling, Distribution, and Variables•45 minutes
In week three, you’ll dig into how to formulate and test appropriate hypotheses for your business goals. You’ll wrap up the week with part three of your capstone project.
What's included
16 videos5 readings4 assignments
16 videos•Total 59 minutes
- Introduction: Experimental Design and Hypotheses•1 minute
- Research Question•5 minutes
- Hypothesis Writing•3 minutes
- Observational vs Experimental Studies•6 minutes
- Experimental Design for Data Analysis•5 minutes
- Introduction: Hypothesis and AB Testing•1 minute
- Hypothesis Testing and AB Testing•5 minutes
- Understanding P-Values•5 minutes
- Confidence Intervals in Data Analytics•4 minutes
- Confidence Intervals in a Spreadsheet•3 minutes
- Hypothesis Testing in a Spreadsheet•4 minutes
- Introduction: Common Mistakes in Statistics•1 minute
- Being Fair: Avoiding Bias•8 minutes
- Types of Errors: Types I and II•2 minutes
- Assumptions•4 minutes
- Week 3 Review•1 minute
5 readings•Total 50 minutes
- Experimental Design Review•10 minutes
- Hypothesis Testing in Spreadsheet Review•10 minutes
- AB Testing Review•10 minutes
- Being Accurate: Avoiding Bias•10 minutes
- False Positives and False Negatives Review•10 minutes
4 assignments•Total 165 minutes
- Practice Quiz: Experimental Design and Hypotheses•35 minutes
- Practice Quiz: Hypothesis and AB Testing•30 minutes
- Capstone Module 3: Testing Your Hypothesis•60 minutes
- Graded Quiz: Experimental Design and Testing•40 minutes
This week you’ll be introduced to various model families and how to create them using Tableau. You’ll also learn how to interpret the results of these models. You’ll complete the fourth and final part of your capstone project.
What's included
19 videos5 readings6 assignments
19 videos•Total 65 minutes
- Introduction: Statistical Modeling•1 minute
- What is Statistical Modeling•3 minutes
- Modeling in Data Analytics•4 minutes
- Common Types of Statistical Modeling•7 minutes
- Introduction: Simple Linear Regression and Classification Methods•1 minute
- Simple Linear Regression•7 minutes
- Simple Linear Regression in Tableau•2 minutes
- Simple Linear Regression in Tableau - Screencast•8 minutes
- Classification Methods in Data Modeling•3 minutes
- Introduction: Cluster Analysis•1 minute
- Cluster Analysis•6 minutes
- Cluster Analysis in Tableau•4 minutes
- Introduction: Time Series•1 minute
- Time Series•3 minutes
- Time Series in Tableau•5 minutes
- Introduction: Choosing a Model•1 minute
- Choosing a Model•4 minutes
- Data Analysis Case Studies•4 minutes
- Weekly Review: Data Modeling•1 minute
5 readings•Total 70 minutes
- Simple Linear Regression Review•10 minutes
- Cluster Analysis Review•10 minutes
- Time Series Analysis Review•10 minutes
- Choosing a Model Review•10 minutes
- Capstone Week 4: Show Me the Model•30 minutes
6 assignments•Total 195 minutes
- Practice Quiz: Statistical Modeling•20 minutes
- Practice Quiz: Simple Linear Regression•25 minutes
- Practice Quiz: Cluster Analysis•20 minutes
- Practice Quiz: Time Series•20 minutes
- Capstone Module 4: Data Modeling•60 minutes
- Statistical Modeling Quiz•50 minutes
This week you will combine and apply all the information you have learned throughout the course and finalize your capstone project. You’ll finish out the course by hearing from a marketing analyst about how they apply the principles you learned in this course in the real-world.
What's included
6 videos1 assignment1 discussion prompt
6 videos•Total 16 minutes
- Introduction: Capstone•1 minute
- Marketing Analyst on Descriptive Statistics•3 minutes
- Marketing Analyst on Sampling, Distributions, and Variables•3 minutes
- Marketing Analyst on Questions and Hypotheses•3 minutes
- Marketing Analyst on Modeling•4 minutes
- Course Summary & Congratulations•2 minutes
1 assignment•Total 30 minutes
- Finalize Your Capstone Project•30 minutes
1 discussion prompt•Total 10 minutes
- Share Your Thoughts!•10 minutes
Earn a career certificate
Add this credential to your LinkedIn profile, resume, or CV. Share it on social media and in your performance review.
Instructor
Explore more from Marketing
- Status: Free Trial
- Status: Free TrialU
University of Colorado Boulder
Specialization
- Status: Free TrialD
DeepLearning.AI
Course
- Status: Free TrialD
DeepLearning.AI
Course
Why people choose Coursera for their career
Learner reviews
- 5 stars
83.45%
- 4 stars
11.27%
- 3 stars
3.75%
- 2 stars
0.50%
- 1 star
1%
Showing 3 of 399
Reviewed on May 7, 2024
I learned alot from this course and Big thanks to the instructors , They are all amazing !
Reviewed on Feb 13, 2023
Absolutely amazing course! Very straightforward and educational. No complicated lessons and perfect explanations for all topics! I wish the rest of the courses were like this! Wonderful job!
Reviewed on Jun 12, 2024
Best course so far in this Professional Certificate
Frequently asked questions
To access the course materials, assignments and to earn a Certificate, you will need to purchase the Certificate experience when you enroll in a course. You can try a Free Trial instead, or apply for Financial Aid. The course may offer 'Full Course, No Certificate' instead. This option lets you see all course materials, submit required assessments, and get a final grade. This also means that you will not be able to purchase a Certificate experience.
When you enroll in the course, you get access to all of the courses in the Certificate, and you earn a certificate when you complete the work. Your electronic Certificate will be added to your Accomplishments page - from there, you can print your Certificate or add it to your LinkedIn profile.
More questions
Financial aid available,