 |
VOOZH | about |
|
VOOZH | about |
Website monitoring is the process of continuously testing your site's uptime, speed, and functionality to ensure every visitor gets a fast, reliable experience.
Dotcom-Monitor goes beyond basic ping checks with real-browser monitoring of logins, carts, checkouts, and APIs, catching issues before they cost you customers.
Simulates real user interactions and scripted workflows to detect slowdowns and performance issues.
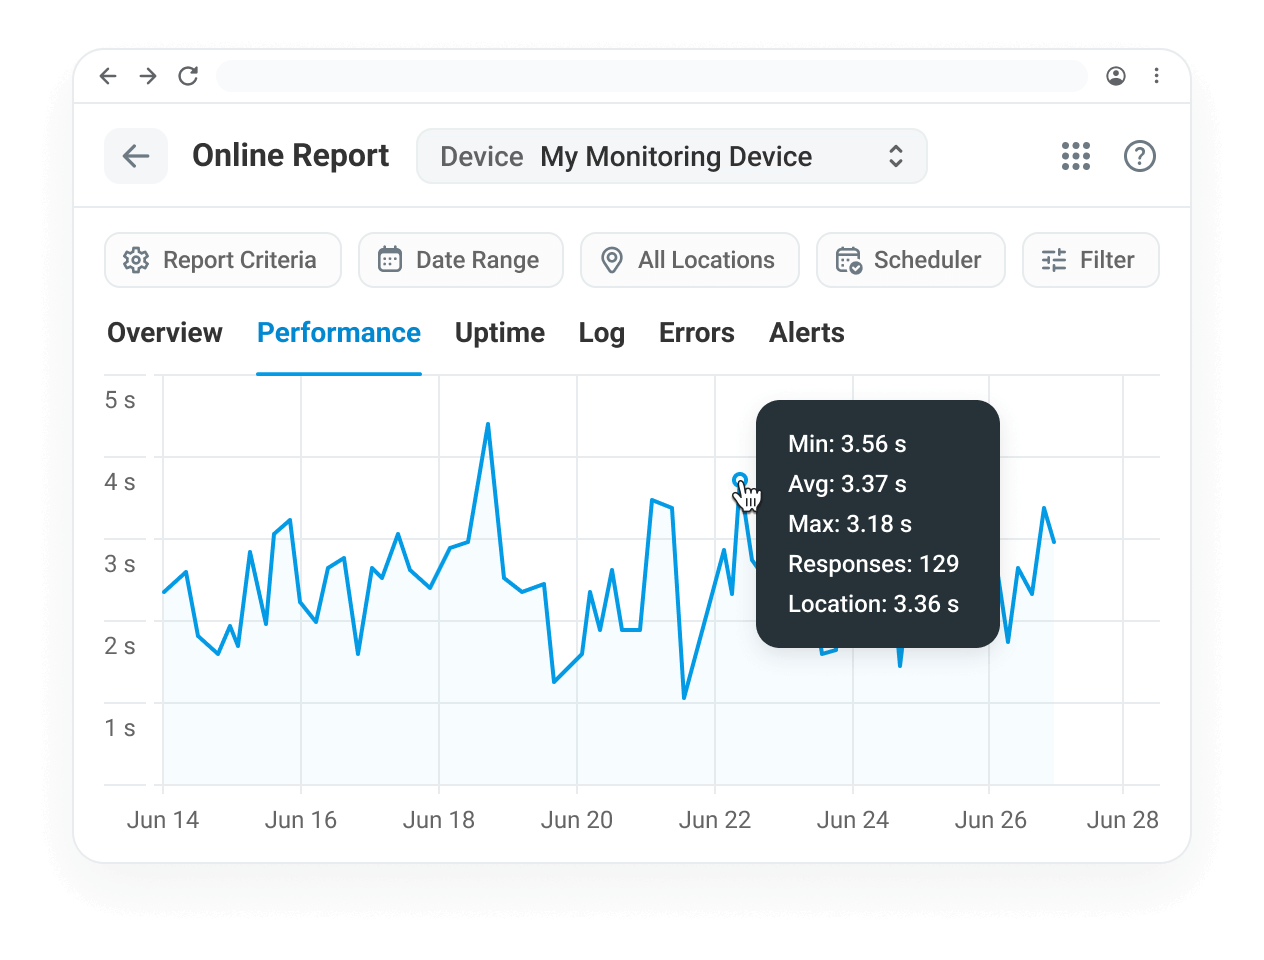
Tracks page speed, uptime, and critical elements in real Chrome, Edge, and mobile browsers.
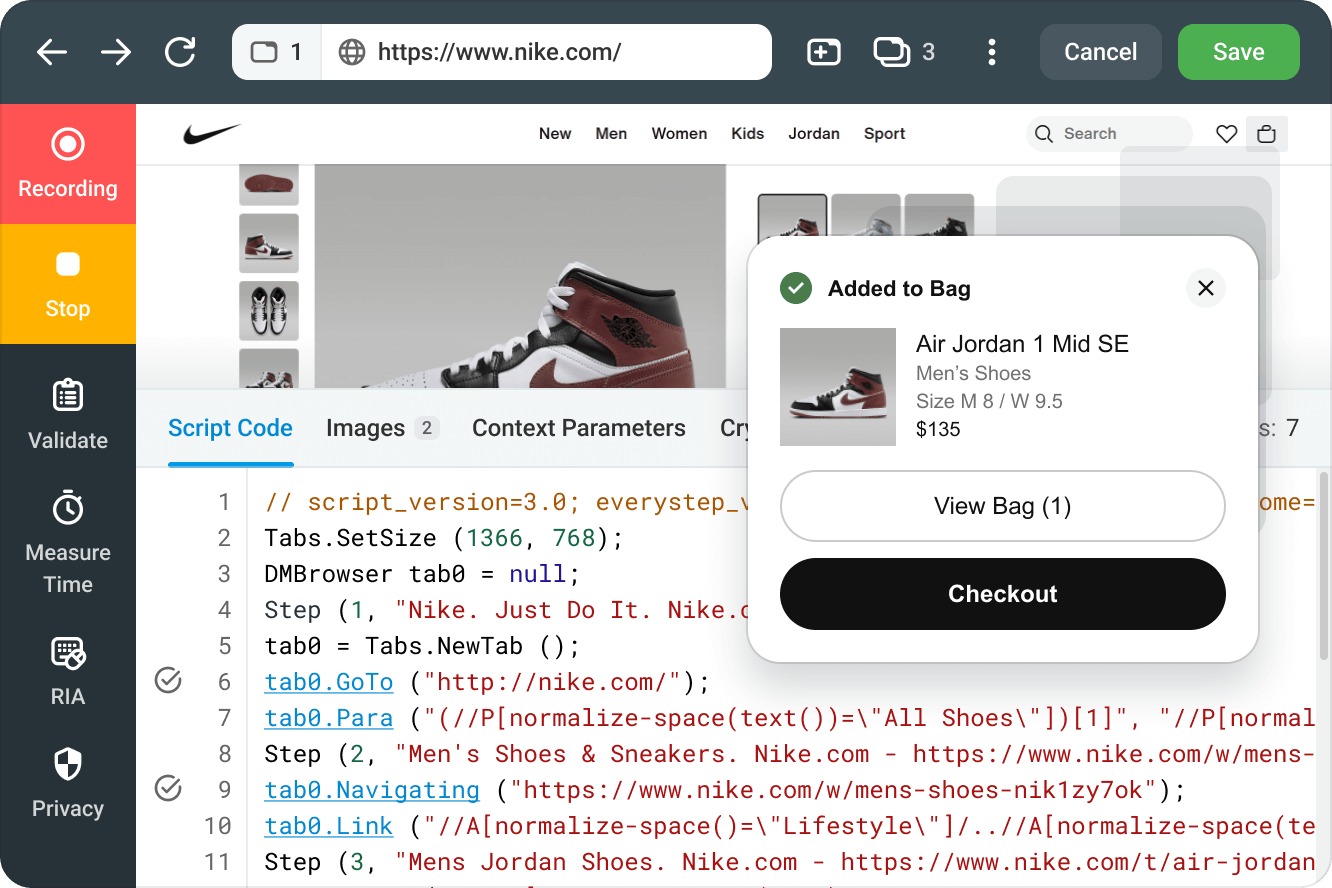
Dotcom-Monitor redefines website monitoring by testing functionality, not just availability. Our real-browser agents step through your most critical workflows (login forms, e-commerce carts, payments, and dynamic content) to proactively detect failures before your users experience them.
Easily configure multi-step monitoring scripts to replicate user behavior across your web apps. Monitor everything from login authentication and checkout flows to dashboards and dynamic forms across devices and geographies.
Monitor APIs as part of your total website and app performance strategy. Import Postman collections or build custom multi-step tests with authentication, chained requests, and response validation.
Uptime is just the beginning. With Dotcom-Monitor, you get real-browser synthetic monitoring that simulates real user experiences in real browsers to uncover what basic HTTP pings can’t.
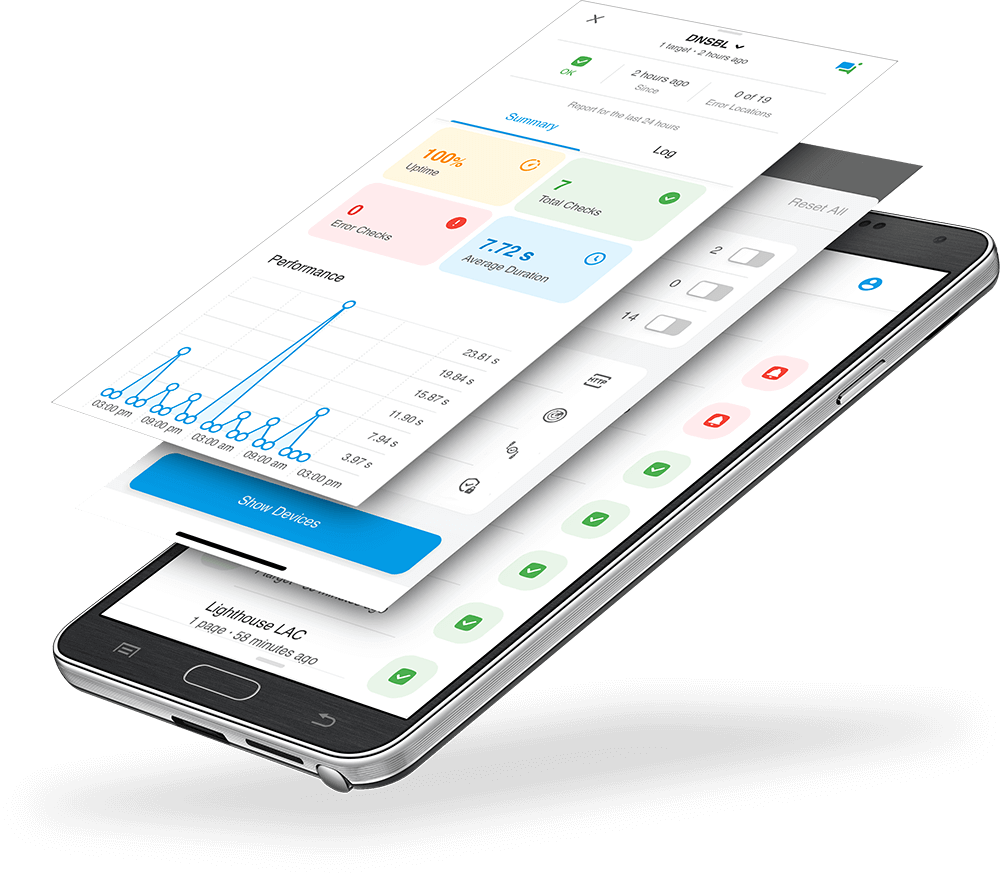
Dotcom-Monitor provides instant failure alerts, detailed waterfall reports, and real-time snapshots to help you pinpoint and fix issues fast, whether it’s a broken button, a slow API, or a failed transaction step.
This website monitoring comparison shows the core capabilities that deliver uptime, performance, and reliability for your digital experiences.
| Capability | What It Solves |
|---|---|
| Real-browser website monitoring | Finds issues pings miss (JS/CSS errors, third-party failures, UX breaks) |
| Transaction monitoring | Validates logins, carts, and checkout, step by step |
| API monitoring | Ensures backend services and dependencies stay reliable |
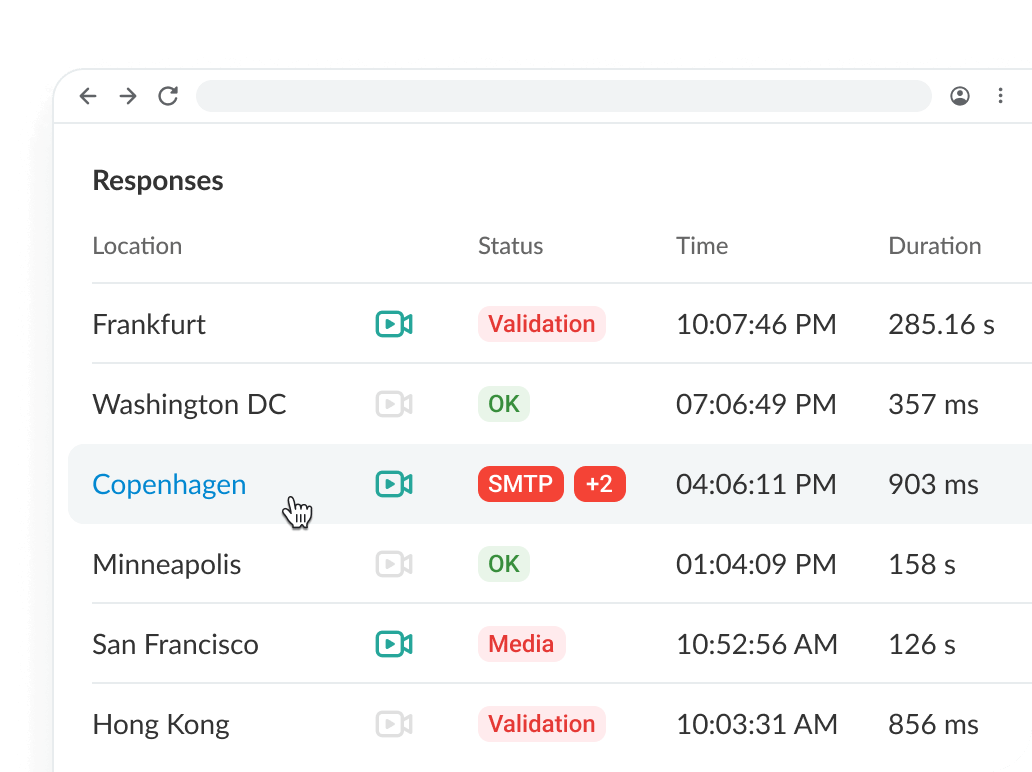
| Global uptime checks | Detects regional outages and measures response time worldwide |
| Waterfalls & screenshots | Accelerates root-cause analysis and incident resolution |
Get full visibility in one platform, from homepage uptime to the final step of a multi-API workflow.
See your site through the eyes of your users. Test actual browser behavior with real-time scripting and diagnostics.
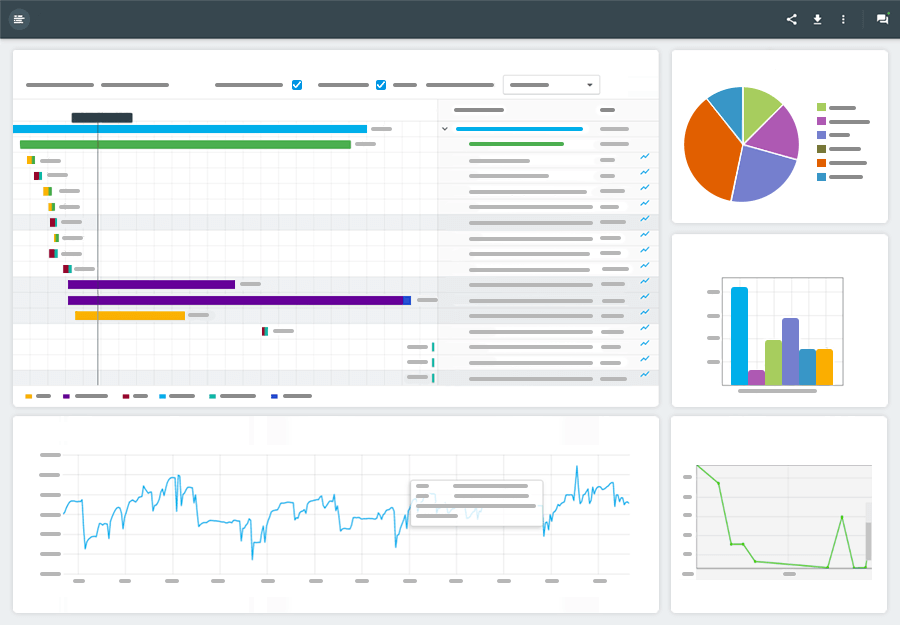
Diagnose errors instantly with full-stack visibility, waterfall views, and live debugging tools.
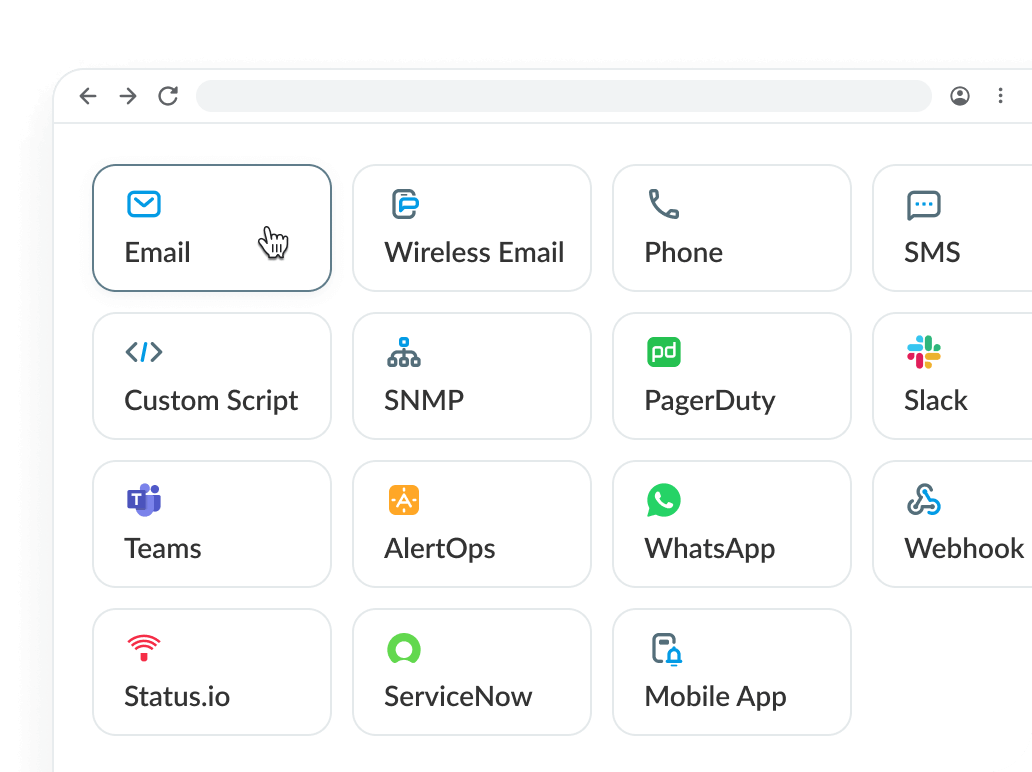
Alert your team where they work: Slack, PagerDuty, Teams, ServiceNow, Webhooks, and more.
Plug in easily. Automate workflows. Keep your monitoring setup hassle-free and powerful.
Website monitoring continuously tests a site's uptime, speed, and functionality in real browsers to catch issues before customers are impacted.
Uptime checks confirm a server responds. Website monitoring validates real user journeys, detects JavaScript and CSS failures, and tests APIs.
Dotcom-Monitor provides real-browser synthetic monitoring, uptime monitoring from 30+ global locations, transaction monitoring for user workflows, API monitoring with authentication support, and performance monitoring including Core Web Vitals tracking.
No. Synthetic monitoring checks run remotely from external servers and add zero load to your production environment.
Run checks every 1–5 minutes for revenue-critical flows, 5–15 minutes for core functions, and less frequently for secondary assets.