
How to track reopened tickets in Zendesk Explore: A complete guide
Last edited February 26, 2026
A high volume of reopened tickets is a clear signal that something's not working in your support process. When customers have to come back because their issue wasn't fully resolved the first time, it creates extra work for your team and damages customer satisfaction.
The good news? Zendesk Explore makes it easy to track reopened tickets and identify patterns. In this guide, I'll walk you through creating reports that show exactly how many tickets are being reopened, who's reopening them, and what you can do about it.
What are reopened tickets and why they matter
In Zendesk, a reopened ticket is any ticket that was changed from Solved or Closed status back to Open or Pending. This typically happens when a customer replies to a solved ticket because their issue wasn't fully resolved, or when an agent realizes they need to add more information.
Why does this metric matter? Reopened tickets indicate:
- Incomplete resolutions: The agent thought the issue was fixed, but the customer disagrees
- Quality gaps: Missing information or unclear communication in the initial response
- Training opportunities: Patterns in reopens can highlight where agents need coaching
- Knowledge base gaps: Common reopen reasons often point to missing help center articles
Industry benchmarks suggest a reopen rate under 5% is considered healthy. If you're seeing higher numbers, it's worth investigating what's driving customers to come back.
The counter-metric to track alongside reopened tickets is first-contact resolution (FCR). When you solve issues completely on the first try, customers don't need to reopen tickets. At eesel AI, we focus on helping teams improve FCR by learning from past tickets and help center content to draft more complete responses from the start.
What you'll need
Before you start building your reopened tickets report, make sure you have:
- Zendesk Explore Professional or Enterprise: The reopened tickets metric requires these plan levels
- Editor or admin permissions: You'll need access to create and save reports in Explore
- Ticket data in Zendesk Support: Your account needs solved tickets to analyze (the more history, the better)
- Basic familiarity with Explore: Understanding how to navigate the report builder will help
If you're not sure about your Explore access, check with your Zendesk administrator. The reopened tickets metric is available in the Support - Tickets dataset, which most support teams have access to.
Creating a reopened tickets report
Let's build a basic report showing reopened tickets per day. This gives you a trend line to see whether your reopen rate is improving or getting worse over time.
Step 1: Create a new report in the Tickets dataset
Start by navigating to Explore in your Zendesk admin panel. Click the Reports icon, then select New report from the report library.
On the Select a dataset page, choose Support, then Support - Tickets. This dataset contains all the ticket-level metrics you'll need, including the reopened tickets count.
Click Start report to open the report builder.
Step 2: Add the Reopened tickets metric
In the Metrics panel on the left, click Add to open the metrics list. Navigate to Tickets, then select Reopened tickets from the available options. Click Apply to add it to your report.
The Reopened tickets metric counts unique tickets that have been reopened at least once. If a ticket gets reopened multiple times, it still only counts once in this metric.
Step 3: Add time-based attributes
To see trends over time, you need to add a date attribute. In the Rows panel, click Add and select Ticket solved - Date. This shows reopened tickets grouped by the date they were originally solved.
Next, add a filter to prevent query timeouts while you're building. In the Filters panel, add Ticket created - Date and set it to a recent time period, like the last 30 days. You can expand this range once your report is working.
Step 4: Customize and save
Now you can adjust how the data displays. Try different visualizations:
- Table: Shows exact numbers for each day
- Line chart: Good for spotting trends over time
- Column chart: Makes it easy to compare days
Add any additional filters that make sense for your analysis, such as filtering by ticket group or specific tags. When you're happy with the report, save it to a dashboard where your team can access it.
Filtering reopened tickets by updater role
Not all reopened tickets indicate quality problems. Sometimes agents reopen tickets by mistake, or they need to add information they forgot. To get a clearer picture of actual customer-initiated reopens, you can filter by who made the update.
Why filter by updater role
Filtering by updater role helps you:
- Distinguish between customer dissatisfaction and agent errors
- Get a more accurate measure of support quality
- Focus coaching conversations on the right issues
- Avoid overreacting to agent mistakes
Using the Updates History dataset
To filter by updater role, you need to use a different dataset. Create a new report and select Support, then Updates History - Tickets. This dataset tracks every update made to tickets, including who made it.
Add the Tickets reopened metric from the Tickets section. Then in the Rows panel, add Updater, then Updater role. Click on the Updater role attribute you just added, select Selected, then choose End user only.
This report now shows only tickets that were reopened by customers, not agents. Add your date filters the same way as before to see trends over time.
Understanding the Reopened tickets metric
There's an important distinction to understand: Reopened tickets and Reopens are two different metrics.
| Metric | What it counts | Use case |
|---|---|---|
| Reopened tickets | Unique tickets with at least one reopen | "How many tickets came back?" |
| Reopens | Total reopen events | "How many times did tickets get reopened?" |
The formula behind the Reopened tickets metric is:
IF (VALUE(Reopens)>0) THEN [Ticket ID] ENDIF
This means it counts each ticket only once, even if it was reopened multiple times. It also excludes tickets that were solved and reopened during the same update (a rare edge case).
Common pitfalls to avoid:
- Don't confuse reopened tickets with open tickets. Reopened specifically means they were solved first.
- Remember that tickets in Closed status cannot be reopened in Zendesk. They would need to be recreated as follow-up tickets.
- The metric looks at whether a ticket has ever been reopened, not whether it's currently in reopened status.
How to act on reopened ticket data
Tracking reopened tickets is only useful if you do something with the data. Here's how to turn those reports into action.
Analyze patterns
Look for trends in your reopened ticket data:
- Which agents have higher reopen rates? This could indicate training needs.
- Which ticket categories get reopened most? You might have product issues or unclear documentation.
- What time periods see spikes? New product releases or seasonal issues often drive reopens.
- Which customer segments reopen tickets? VIP customers might have higher expectations.
Root cause analysis
When you dig into reopened tickets, common causes emerge:
- Missing details: The resolution lacked critical information the customer needed
- Superficial fixes: Quick solutions that didn't address the underlying problem
- Communication gaps: The agent and customer weren't on the same page about what was fixed
Knowledge base improvements
Reopened tickets often reveal gaps in your help center. If customers keep coming back with the same questions, your knowledge base articles might need:
- More complete troubleshooting steps
- Clearer explanations of complex features
- Better search keywords so customers find them
Agent coaching opportunities
Use reopened tickets as coaching moments. Review them with agents to identify:
- Where they could have asked better questions
- How to verify issues are truly resolved before closing
- When to escalate instead of attempting a quick fix
AI-powered solutions
If you're looking to reduce reopened tickets systematically, consider how AI can help. At eesel AI, our AI Agent learns from your past tickets and help center content to provide more complete resolutions. Instead of rushing to close tickets, it takes time to understand the full context and delivers responses that actually solve the problem.
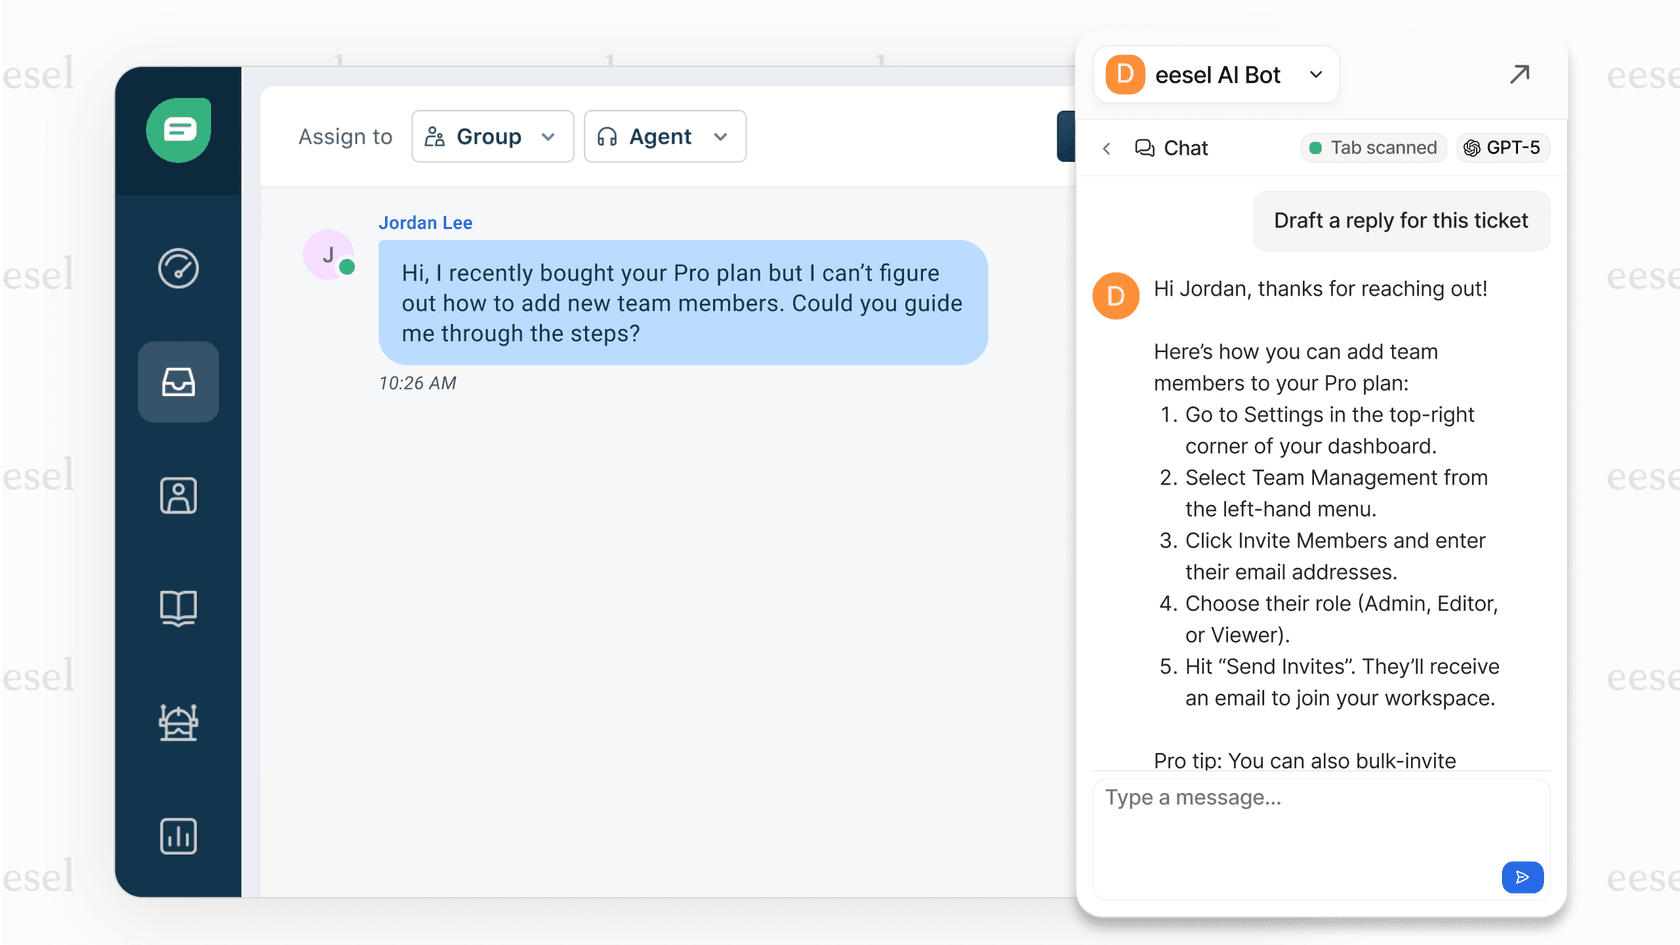
For teams that prefer human oversight, our AI Copilot drafts responses for agents to review. It suggests complete answers based on similar past tickets, helping agents catch missing details before they hit send.
Start improving your support quality today
Tracking reopened tickets in Zendesk Explore is straightforward, but the real value comes from acting on what you learn. Start with a simple daily report, then dig deeper into patterns. Look for agents, categories, or time periods that stand out.
Remember that reopened tickets are a symptom, not the disease. The goal isn't just to reduce the number, it's to improve first-contact resolution so customers get what they need the first time.
If you're ready to take the next step, consider how an AI teammate could help. eesel's AI agent for Zendesk learns from your existing tickets and help center to draft more complete responses, reducing the gaps that lead to reopened tickets. You can start with our AI Copilot to assist your agents, or go fully autonomous with our AI Agent. Check out our pricing to find a plan that fits your team.
Frequently Asked Questions
Share this article
Article by
Stevia Putri
Stevia Putri is a marketing generalist at eesel AI, where she helps turn powerful AI tools into stories that resonate. She’s driven by curiosity, clarity, and the human side of technology.