
How to use the Zendesk Explore tickets solved metric: A complete guide
Last edited February 26, 2026
If you've ever stared at Zendesk Explore wondering why there are two different metrics that both sound like they count solved tickets, you're not alone. The distinction between "solved tickets" and "tickets solved" trips up even experienced admins. Get it wrong and your reports tell a completely different story than what's actually happening in your support queue.
Let's break it down. This guide explains the critical difference between these two metrics, when to use each one, and how to build accurate reports that actually reflect your team's performance.
| Use case | Use this metric | Dataset |
|---|---|---|
| Current workload by agent | Solved tickets | Tickets |
| Tickets solved today/this week | Tickets solved | Tickets |
| Trends over time (created vs solved) | Tickets solved | Updates history |
| SLA compliance tracking | Tickets solved | Updates history |
| Agent performance reviews | Depends on goal | Either |
Bottom line? If you're tracking trends or measuring performance over time, you almost always want Tickets solved from the Updates history dataset. If you need a current snapshot of solved workload, use Solved tickets from the Tickets dataset.
For teams looking to go beyond manual report building, we offer autonomous resolution tracking that provides these insights without navigating datasets and formulas. Our AI agent for Zendesk learns from your tickets and help center to surface resolution insights automatically.
Choosing the right dataset for your report
Zendesk Explore organizes data into datasets, and choosing the wrong one is the fastest way to get confusing results. Here's how to decide.
Tickets dataset: For current state and snapshots
Use this when you want to know the status of tickets right now. It contains general ticket information without historical changes.
- Best for: Current workload, open ticket counts, backlog analysis
- Time attributes: Ticket created, Ticket solved (most recent), Ticket updated
- Key metrics: Solved tickets, Unsolved tickets, Tickets solved - Last 7 days
Updates history dataset: For tracking changes over time
This dataset records every change made to tickets. It's event-based, which means it tracks what happened and when.
- Best for: Trend analysis, created vs solved reports, agent activity tracking
- Time attributes: Update timestamp (when changes occurred)
- Key metrics: Tickets created, Tickets solved, Agent updates, Comments
Backlog history dataset: For historical snapshots
This shows how many unsolved tickets existed on any given date. Explore collects this data every time your data synchronizes.
- Best for: Understanding backlog growth or reduction over time
- Limitation: Only captures data from sync points, not real-time
Quick decision framework
Ask yourself: what question am I trying to answer?
- "How many tickets are solved right now?" → Tickets dataset
- "How many tickets did we solve this week?" → Updates history dataset
- "What's our backlog trend?" → Backlog history dataset
- "Are we keeping up with ticket volume?" → Updates history dataset (created vs solved)
How to build a created vs solved tickets report
This is one of the most common reports support teams need. It shows whether you're treading water, falling behind, or getting ahead. Here's how to build it.
Step 1: Create a new report in the Updates history dataset
Navigate to Explore, click the reports icon, then click New report. On the "Select a dataset" page, choose Support > Support - Updates history, then click Start report.
Step 2: Add the metrics
In the Metrics panel, click Add. From the list, choose:
- Tickets > Tickets created
- Tickets > Tickets solved
Then click Apply.
Why these metrics together? Tickets created shows volume coming in. Tickets solved shows volume going out. When solved consistently exceeds created, you're reducing backlog. When created exceeds solved, your queue is growing.
Step 3: Configure date filtering
In the Filters panel, click Add. Choose Time - Ticket update > Update - Year, then click Apply.
Click on the Update - Year filter you just added, then click Edit date ranges. You can choose a simple range like "This year" or click the Advanced tab for more options like "12 weeks in the past to 1 week in the past."
Pro tip: For accurate weekday analysis, always use full weeks of data. Partial weeks can skew your results.
Step 4: Add columns and visualization
In the Columns panel, click Add. Choose Time - Ticket update > Update - Date to show daily results. Click Apply.
From the Visualizations menu, choose the Column chart type. From the chart configuration menu:
- Click Chart and check Stacked
- Uncheck Aggregated values
- Click Displayed values and choose to show values inside the columns
Click Save to save your report. You can now add it to a dashboard or reopen it from the library later.
Building custom metrics for advanced tracking
Sometimes the built-in metrics don't give you exactly what you need. Here are two common scenarios where calculated metrics help.
First solved date metric
Use this when you want to track when tickets were first resolved, even if they were later reopened. This is useful for measuring first-touch resolution rates.
To create it:
- In your report, click the calculations menu (calculator icon)
- Choose Standard calculated metric
- Name it "First solved update date"
- Paste this formula:
IF ([Changes - Field name] = "status" AND [Changes - New value] = "solved"
AND [Changes - Previous value] != "solved" AND [Update - Timestamp] =
DATE_FIRST_FIX([Update - Timestamp], [Ticket ID], [Changes - Field name]))
THEN [Update ticket ID]
ENDIF
- Click Save
Source: Zendesk Help Center - Creating a ticket first solved date metric
Percentage solved within SLA
Want to track what percentage of tickets meet your SLA targets? You'll need two calculated metrics.
First, create a metric for tickets solved within your threshold (example: 20 minutes):
IF (VALUE(Full resolution time (min)) < 20 AND [Ticket status - Unsorted] = "Solved")
THEN [Ticket ID]
ENDIF
Then create a percentage metric:
COUNT(Tickets solved in less than 20 minutes) / COUNT(Solved tickets)
Format this as a percentage and apply it to your reports. You can adjust the threshold (20 minutes) to match your SLA.
Source: Geckoboard - % Tickets Solved in Less than 20 Minutes
Common mistakes and how to avoid them
Even experienced admins make these errors. Here's what to watch for.
Mistake 1: Using the Tickets dataset for trend analysis
The Tickets dataset shows current status, not historical events. If you try to build a "created vs solved by date" report using the Tickets dataset, your numbers won't match reality. Always use the Updates history dataset for trend reports.
Mistake 2: Ignoring business hours vs calendar hours
Zendesk tracks both. If your SLA is based on business hours but you're looking at calendar hours in your report, you'll get misleading results. Check which time metric you're using:
- Calendar hours: "Full resolution time (min)"
- Business hours: "Full resolution time - Business hours (min)"
Mistake 3: Not accounting for the margin of error
Zendesk acknowledges that some calculations in the Updates history dataset have a small margin of error due to the way metrics are computed. For most operational reporting, this doesn't matter. But if you're doing precise financial calculations or executive dashboards, validate your numbers against ticket-level data.
Source: Zendesk - Reporting on created and solved tickets
Mistake 4: Double-counting solved-to-closed transitions
The "Tickets solved" metric in the Updates history dataset already excludes solved-to-closed transitions. But if you're building custom formulas, make sure you don't count these transitions as separate resolutions.
Validation tips
- Spot-check sample tickets against your report numbers
- Compare "Tickets solved" in Updates history to "Solved tickets" in Tickets dataset for the same time period. They should be close (though not identical due to reopened tickets).
- Test calculated metrics with a small date range first
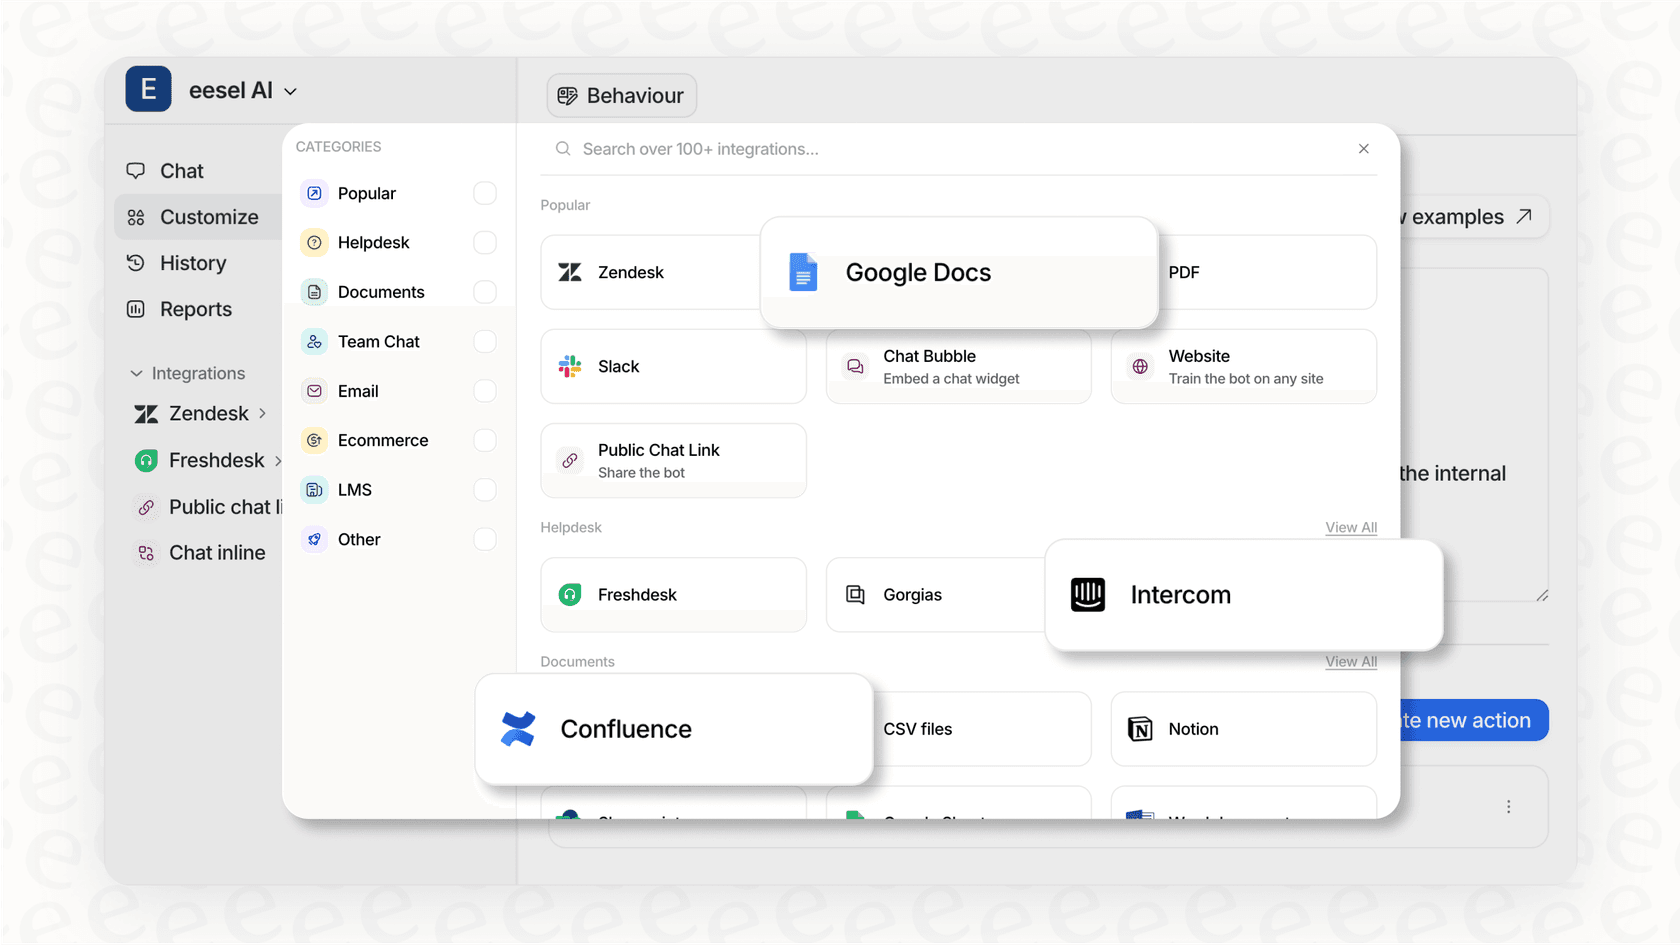
Going beyond basic reporting with our AI agent
Zendesk Explore is powerful, but it requires manual report building, dataset knowledge, and formula writing. For teams that want resolution insights without the complexity, there's another option.
Our AI agent integrates directly with Zendesk and provides autonomous resolution tracking. Instead of building reports, you get:
- Real-time resolution insights without custom formulas
- Natural language queries - ask "how many tickets did we solve this week?" instead of navigating datasets
- Automated tracking of resolution rates, SLA compliance, and agent performance
- No manual report maintenance - insights update automatically as tickets flow through your system
For teams already using Zendesk, we work alongside your existing setup. Our AI learns from your past tickets, help center, and macros to provide insights that match your specific business context.
If you're spending more time building reports than acting on insights, it might be time to consider an approach that handles the analytics automatically.
Frequently Asked Questions
Share this article
Article by
Stevia Putri
Stevia Putri is a marketing generalist at eesel AI, where she helps turn powerful AI tools into stories that resonate. She’s driven by curiosity, clarity, and the human side of technology.