Big Data refers to vast and rapidly growing volumes of data that are too large and complex for traditional data processing tools to manage. This data comes in many forms structured (e.g., tables), semi-structured (e.g., JSON, XML), and unstructured (e.g., text, images, video).
With the explosion of devices, sensors, online services, and digital platforms, data is now generated at an unprecedented rate. This growth makes it essential for organizations to adopt advanced tools and technologies to capture, store, analyze, and utilize this data effectively.
Practical Uses of Big Data
Organizations use Big Data to:
Make smarter decisions by identifying trends and patterns
Predict customer behavior and personalize user experiences
Improve operational efficiency by finding process inefficiencies
Innovate faster by identifying new business opportunities
Enhance risk management by detecting fraud or security threats
Big Data transforms raw information into actionable insights that help companies gain a competitive edge.
The 5 V’s of Big Data
Volume: Refers to the huge amount of data generated every second-ranging from terabytes to petabytes. Example: YouTube uploads 500+ hours of video every minute.
Velocity: The speed at which data is created, shared, and processed. Data streams in from sensors, social media, and transactions in real-time.
Variety: Data comes in multiple formats-text, audio, images, videos, logs, sensor data, etc. Handling all these types together is complex
Veracity: Refers to the trustworthiness and accuracy of the data. Inconsistent, duplicated, or noisy data can lead to wrong insights.
Value: Not all data is useful. The key is extracting relevant data and turning it into business value through analytics.
Additional V’s:
Variability: Data meaning may change over time or context.
Visualization: Making complex data understandable through visual tools (charts, graphs, dashboards).
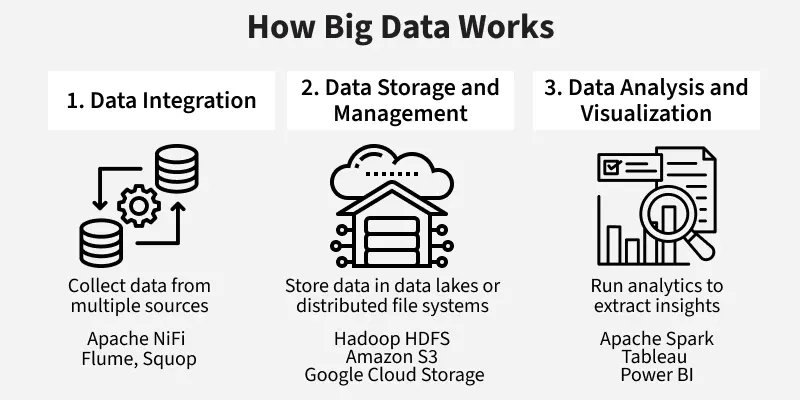
How Big Data Works
To make Big Data useful, organizations follow a 3-step process:
