 |
VOOZH | about |
|
VOOZH | about |
The Memory Tab in Mozilla Firefox is a powerful tool for developers looking to analyze the memory usage of their browser and troubleshoot performance issues. By using the Memory tab in the Developer Tools, you can inspect how memory is being used by different tabs, extensions, and websites. This tool is especially useful for identifying memory leaks, optimizing performance, and ensuring that your browser operates efficiently even when handling multiple tabs and heavy web applications.
The Memory tab allows you to track objects that are not being properly garbage collected, which can indicate a memory leak. This is especially helpful for web developers who need to ensure that their applications perform well over time.
By monitoring the memory usage of different parts of a webpage, developers can identify inefficient use of memory and optimize their applications to be faster and more resource-friendly.
The Memory tab can also show you how much memory each open tab is using, making it easier to spot resource-heavy tabs or extensions that may be slowing down your browser.
F12 or right-click anywhere on a webpage and select Inspect to open the Developer Tools.Ctrl + Shift + I.In the Developer Tools panel, click on the Memory tab at the top. This tab is designed to show detailed memory usage, which includes the memory used by JavaScript objects, DOM nodes, and other resources in the page.
If the Memory tab is not visible:
It provides various options for capturing memory usages in snapshot which can be stored or compared or visualize by the user. A snapshot is just the memory state at a particular point in time.
A button in the top-left corner is provided in the memory tab to take snapshot. On Clicking it we will see an entry for the new snapshot, including its timestamp, size, and controls to save or clear this snapshot and on the right-hand side the view of the snapshot will be presented. We can have multiple snapshot at a time but on refreshing the page it gets deleted.
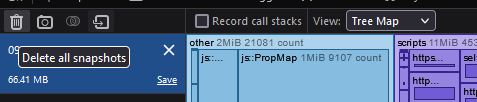
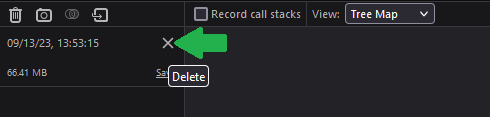
These snapshot which are not required can be removed to make the snapshots list clean for use.
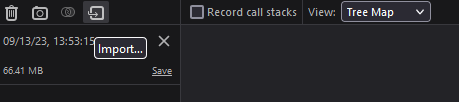
We can share the snapshot among one another but use it in the memory tab we have to import it via the import button.
To import snapshot you must have file with ".fxsnapshot" extension. There will be a button present alongside with "Compare snapshots" button. A browse dialog box will appear where you locate the life to be imported.
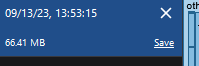
We can save the snapshot in our machine or share the snapshot with others to do that we have to first save it somewhere in our local machine to do that we use the save button.
To save the snapshot just press the save button present in the snapshot pane a browse dialog box will appear to save the file in a specific location with ".fxsnapshot" extension which can be imported.
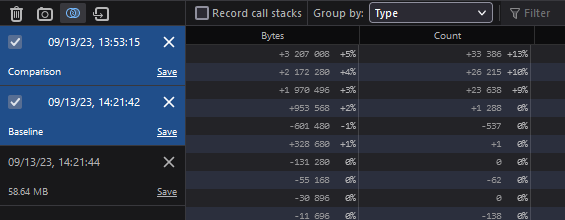
During development we may want to check the memory usage after some changes is made to the site. To do so be can capture some snapshots before the changes are made and after the changes are made and then compare there snapshots. But at one time only two snapshot can be compared.
You can compare two snapshots at a time. To compare two click the button after the take snapshot button. You will then have to check two snapshots you want to compare.
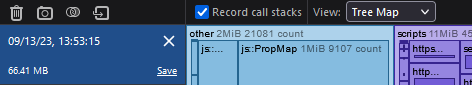
To know exactly where in your code you are allocating memory check “Record call stacks”. This option record memory calls before the memory is allocated so after checking this option don't forget refresh the page and take the snapshots again.
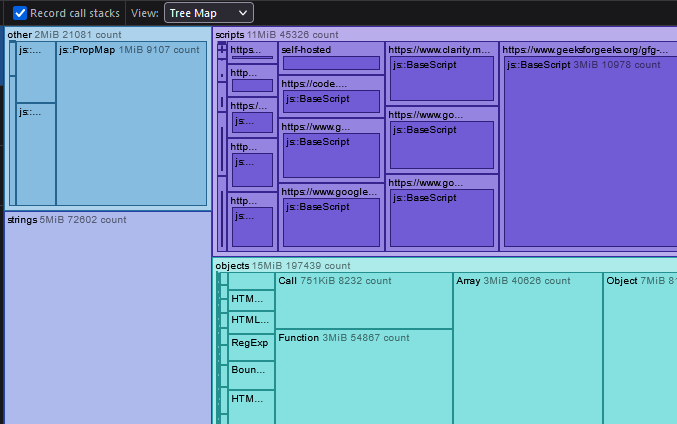
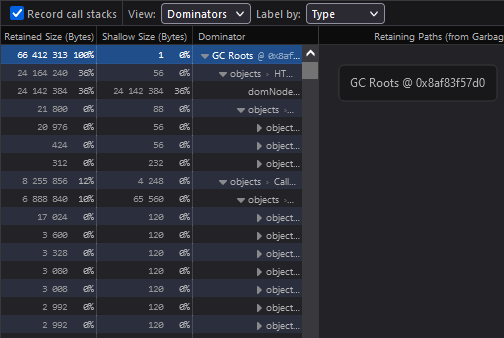
For every snapshot there are three main views provided by the Memory Tool.
Note: If you’ve checked “Record call stacks” then the Aggregate and Dominators views can show you exactly where in your code allocations are happening.
The Memory Tab in Mozilla Firefox is a vital tool for developers looking to optimize the performance of their websites and applications. By using it to track memory usage and identify memory leaks, developers can ensure their websites are efficient and responsive, even as they scale. Whether you're troubleshooting slow performance, fixing memory leaks, or optimizing memory usage for large web apps, the Memory tab provides invaluable insights into how your browser manages resources.