Flowcharts are the visual representations of an algorithm or a process. Flowcharts use symbols/shapes like arrows, rectangles, and diamonds to properly explain the sequence of steps involved in the algorithm or process. Flowcharts have their use cases in various fields such as software development, business process modeling, and engineering.
Why use Flowcharts?
Flowcharts are used due to the numerous amount of benefits they provide. Below are some of the important reasons to use flowcharts:
They provide clarity and simplification to the complex processes and algorithms, which in turn helps other people to understand them easily.
Flowcharts provide a universal visual language that can be understood by anyone across different teams and helps reduce miscommunications.
They are an optimal solution for documenting standard operating procedures, workflows, or business processes. This makes it easier to train new employees.
Flowcharts help in increasing the visualization of the problem being solved which enables more informed and data-driven choices.
Types of Flowcharts
There are many types of flowcharts, each is designed to represent different kinds of processes and information. Some common types of flowcharts are:
Process Flowchart: It represents the sequence of steps in a process. They are frequently used in business process modeling, manufacturing, and project management
Swimlane Flowchart: It organizes the process into different lanes, each representing a different person or department and is used for illustrating how different teams or departments collaborate within a process
Workflow Diagram: It represents how tasks, documents, or information move through a system and is commonly used in office processes or software development
Data Flow Diagram (DFD): It focuses on detailing the inputs, processes, and outputs. Used in system design and analysis to model the flow of data within a system
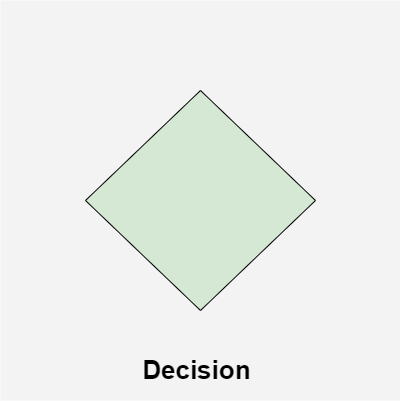
Decision Flowchart: It focuses on mapping out decision points within a process and the possible outcomes of each decision. It is used in decision-making scenarios
Symbols used in Flowchart Designs
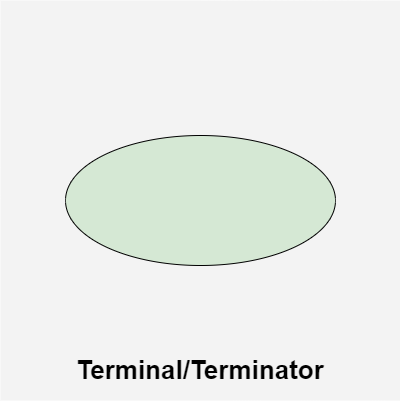
1. Terminal/Terminator
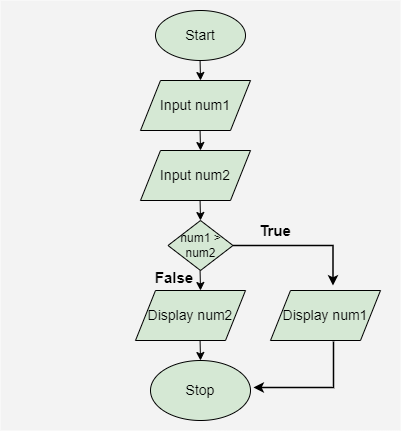
The oval symbol indicates Start, Stop and Halt in a program's logic flow. A pause/halt is generally used in a program logic under some error conditions. Terminal is the first and last symbols in the flowchart.
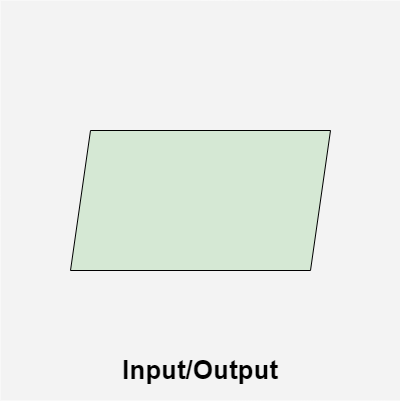
A parallelogram denotes any function of input/output type. Program instructions that take input from input devices and display output on output devices are indicated with parallelogram in a flowchart.
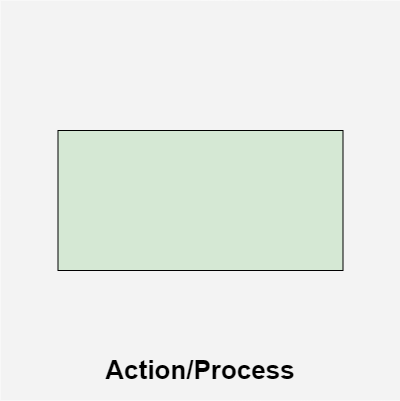
A box represents arithmetic instructions, specific action or operation that occurs as a part of the process. All arithmetic processes such as adding, subtracting, multiplication and division are indicated by action/process symbol.
Whenever a flowchart becomes complex, it is useful to use connectors to avoid confusion. Connectors are used to indicate a jump from one part of the flowchart to another without drawing long or complicated lines. An On-Page Connector shows the continuation of the flowchart on the same page and is represented by a small circle.
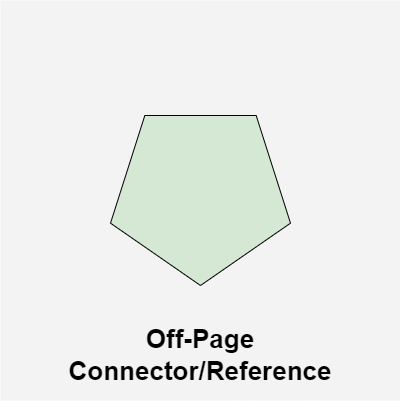
Whenever a flowchart spreads over more than one page, it is useful to use connectors to avoid confusion. Connectors are used to indicate a jump from one part of the flowchart to another without drawing long or complicated lines. An Off-Page Connector shows the continuation of the flowchart on a different page and is represented by a pentagon.
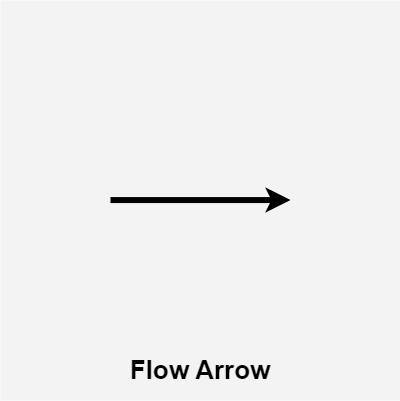
Flow lines indicate the exact sequence in which instructions are executed. Arrows represent the direction of flow of control and relationship among different symbols of flowchart.
