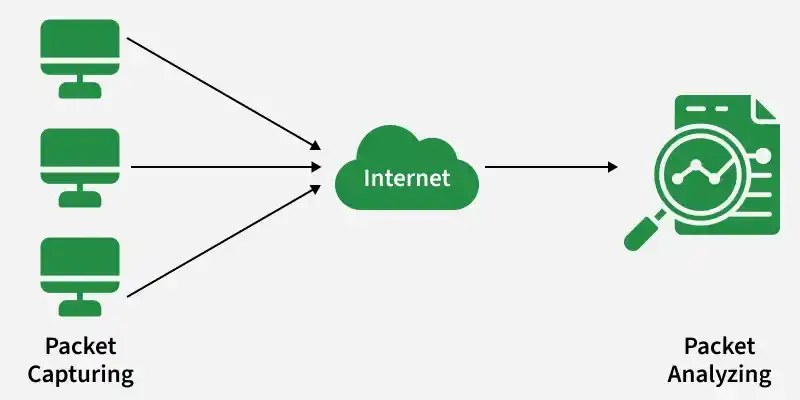
Wireshark is a powerful network protocol analyzer used to capture and inspect packets traveling across a network. It helps users understand traffic flow, detect issues, and analyze protocols in deep detail.
Captures real-time network traffic using promiscuous mode and stores it in pcap files for analysis.
Provides detailed views of packets with filtering options to isolate specific IPs, ports, or protocols.
Useful for troubleshooting, security monitoring, and learning how networks and applications communicate.
Wireshark captures network traffic by placing your Network Interface Card (NIC) into promiscuous mode, allowing it to view all packets on the network segment, not just those addressed to your system.
How Capturing Works
Captures traffic in real time and stores it in .pcap or .pcapng file formats
Uses Npcap (Nmap’s packet capture library) on modern systems
Supports capture filters to limit what is collected (e.g., only HTTP packets or traffic from a specific IP)
2. Packet Analysis
After capturing, Wireshark offers powerful tools to analyze packets in depth. You can narrow the view using display filters, making it easier to inspect specific conversations or protocols.
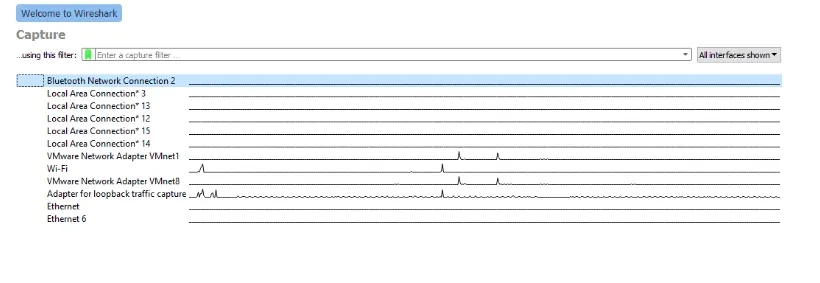
To start sniffing, select one interface and click on the blue shark fin icon in the top left corner.
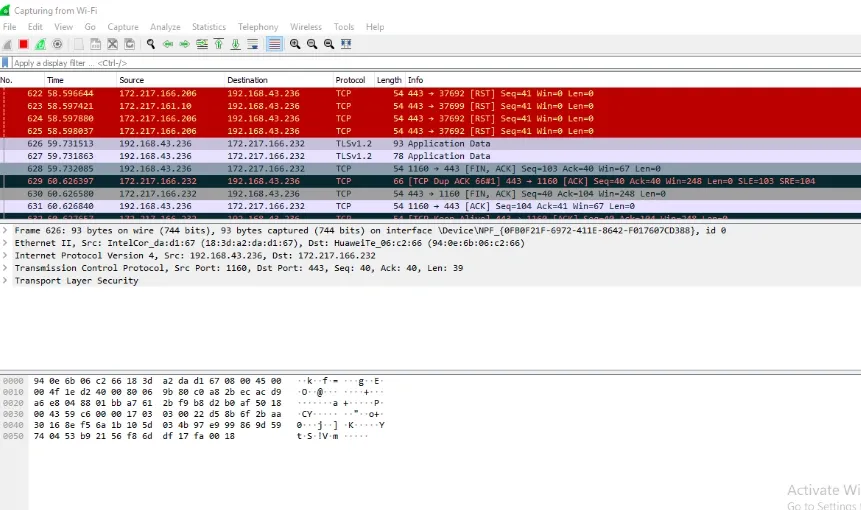
The data capture screen has three panes.
The top pane shows real-time traffic, the middle one shows information about the chosen packet, and the bottom pane shows the raw packet data.
The top pane shows the source address (IPv4 or IPv6), destination address, source and destination ports, the protocol to which the packet belongs, and additional information about the packet.
Since there are a lot of packets going in and out every second, looking at all of them or searching for one type of packet will be tedious.
This is why packet filters are provided.
Packets can be filtered based on many parameters like IP address, port number, or protocol at the capture level or at the display level. A display filter does not affect packet capture; it only controls which packets are visible during analysis.
Capture Filters
Capture filters in Wireshark allow you to restrict which packets are recorded before the capture begins. They help reduce noise by collecting only the traffic you're interested in.
Common Capture Filters
1. host: Captures traffic to or from a specific device Example: host 192.168.1.10
2. net: Captures traffic within a network or subnet Example: net 192.168.1.0/24
Can be prefixed with src or dst for direction control:
src net 10.0.0.0/8
dst net 172.16.0.0/16
3. port: Captures traffic on a specific port Example: port 80 Can also use direction:
src port 53
dst port 443
4. Logical Operators: Used to combine multiple conditions
and
or
not
Example: host 10.0.0.5 and not port 22
Display Filter Examples
Display filters refine captured traffic and help focus on specific packets.
tcp.port == 80 or udp.port == 53: Shows traffic on specific TCP or UDP ports
http.request.uri matches "parameter=value$": Shows HTTP requests where the URI ends with a specific parameter
ip.src == 192.168.0.0/16 and ip.dst == 192.168.0.0/16: Shows traffic within a specific network range
Logical operators (and, or, not) can also be used here.
Wireshark Plugins
Wireshark supports plugins to extend functionality. These can:
Provide deeper insights and custom statistics
Add support for new or custom protocols
Improve collaboration with other tools or monitoring frameworks
Help manage capture file formats and troubleshooting
Plugins make Wireshark adaptable for advanced network forensics and custom workflow needs.
Applications of Wireshark
Wireshark can be used for a wide range of practical tasks, such as:
Diagnosing network or Wi-Fi connectivity problems
Monitoring devices for unusual or malicious traffic
Testing and debugging network-enabled applications
Learning and teaching how network protocols operate
