Annotations in MATLAB is a way of adding explanation or notes to the plots. Annotations add more information to the plots. There are different syntax formations for adding annotations to a plot:
- annotation(lineType,x,y)
- annotation(lineType)
- annotation(shapeType,dim)
- annotation(shapeType)
- annotation(___,Name,Value)
Let's discuss all the above functions in detail:
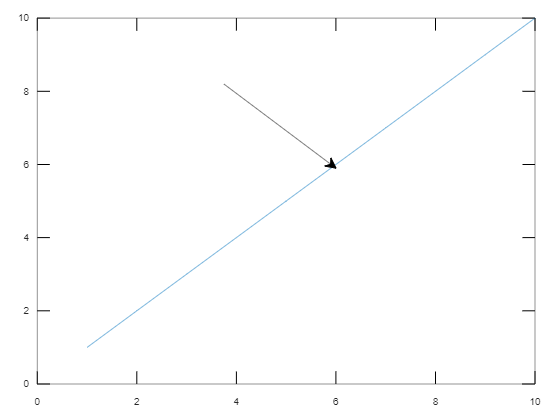
annotation(lineType,x,y)
- Creates a line or arrow annotation between two points in the current figure.
- lineType takes different values as 'line', 'arrow', 'doublearrow', or 'textarrow'.
- x and y are two-element vectors of the form [x_begin x_end] and [y_begin y_end], respectively.
- Annotation has starting point as (x_begin,y_begin) and ending point as (x_end,y_end).
Example :
- Draw a plot y = x using plot(1:10).
- Specify x and y values i.e starting point as (0.4, 0.8) and ending point as (0.6. 0.6).
- Specify lineType as 'arrow' with x and y as two-element vectors.
Output :
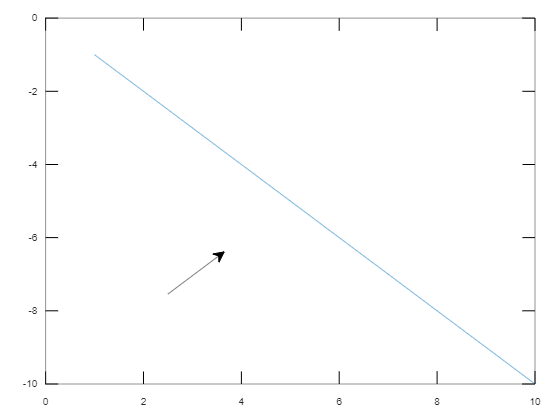
👁 Imageannotation(lineType)
- Creates an annotation of specified "lineType" with default position starting from (0.3, 0.3) and ending at (0.4, 0.4).
Example :
- Draw a plot y = -x.
- Specify lineType as 'arrow'.
Output :
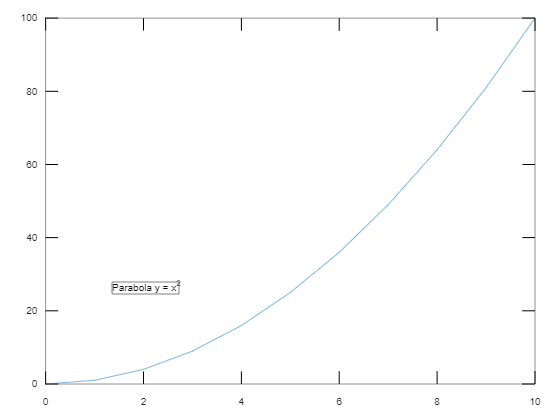
👁 Imageannotation(shapeType,dim)
- Creates an annotation in the shape of a rectangle or eclipse with given dim to the plot.
- ShapeType takes values as 'rectangle', 'ellipse', or 'textbox'.
- dim is a vector of size 4 as [x y w h], where (x, y) is the lower-left endpoint of rectangle and w, h are width and height of rectangle respectively.
Example :
- Plot the graph y=x^2 from 0 to 10.
- Specify dim as the lower-left endpoint (0.2, 0.3) with width and height as 0.3 and 0.3 respectively.
- Specify annotation of shape textbox by including a string in the textbox.
Output :
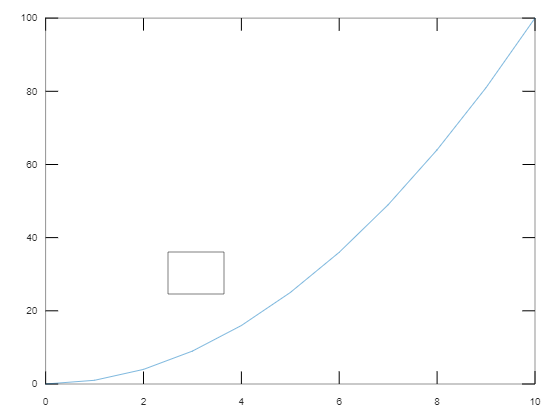
👁 Imageannotation(shapeType)
- Creates the annotation with the mentioned shape in the default position so that the lower-left endpoint is at (0.3, 0.3) and the width and height are both 0.1.
Example :
- Plot the graph y = x^2.
- Create an annotation of shapeType = 'rectangle' with default positions of the rectangle.
Output :
👁 Imageannotation(___,Name,Value)
- Creates an annotation by specifying properties as Name-Value pair arguments.
- Some of the properties are like String, color, FaceColor, FaceAlpha etc.
Example :
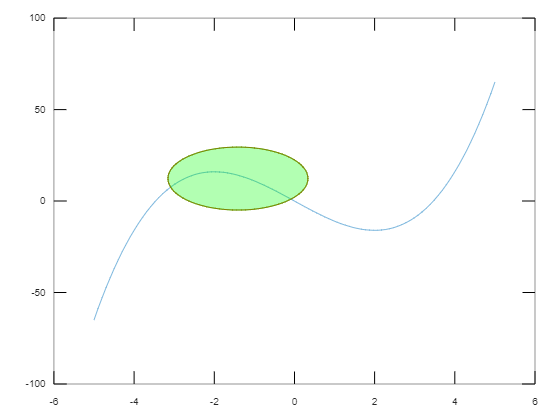
- Plot the graph y = x^3-12x.
- Specified the eclipse annotation with color as 'red' and interior color as 'green' and FaceAlpha = 0.3. specifies FaceColor is slightly transparent.
Output :
👁 Image
