 |
VOOZH | about |
|
VOOZH | about |
The Count-Min Sketch is a probabilistic data structure and is defined as a simple technique to summarize large amounts of frequency data. Count-min sketch algorithm talks about keeping track of the count of things. i.e, How many times an element is present in the set.
Count-min sketch approach was proposed by Graham Cormode and S. Muthukrishnan. in the paper approximating data with the count-min sketch published in 2011/12. Count-min sketch is used to count the frequency of the events on the streaming data. Like the Bloom filter, Count-min sketch algorithm also works with hash codes. It uses multiple hash functions to map these frequencies on to the matrix (Consider sketch here a two dimensional array or matrix).
Since Count-Min Sketch is used to find the frequency of an element, one might think if there is actually a need for such data structure! The answer is Yes. Let us see with the help of an example.
Let us try to solve this frequency estimation problem using a MultiSet Data Structure
Let's try to implement this data structure using MultiSet with the below source code and try to find out the issues with this approach.
Output:
Now let's look at the time and space consumed with this type of approach.
Number of UUIDs | Insertion Time(ms) |
|---|---|
|
10 |
<25 |
|
100 |
<25 |
|
1,000 |
30 |
|
10,000 |
257 |
|
100,000 |
1200 |
|
1,000,000 |
4244 |
Let's have a look at the memory (space) consumed:
Number of UUIDs | JVM heap used(MB) |
|---|---|
|
10 |
<2 |
|
100 |
<2 |
|
1,000 |
3 |
|
10,000 |
9 |
|
100,000 |
39 |
|
1,000,000 |
234 |
We can easily understand that as data grows, the above approach is consuming a lot of memory and time to process the data.
This can be optimised if we use the Count-Min Sketch.
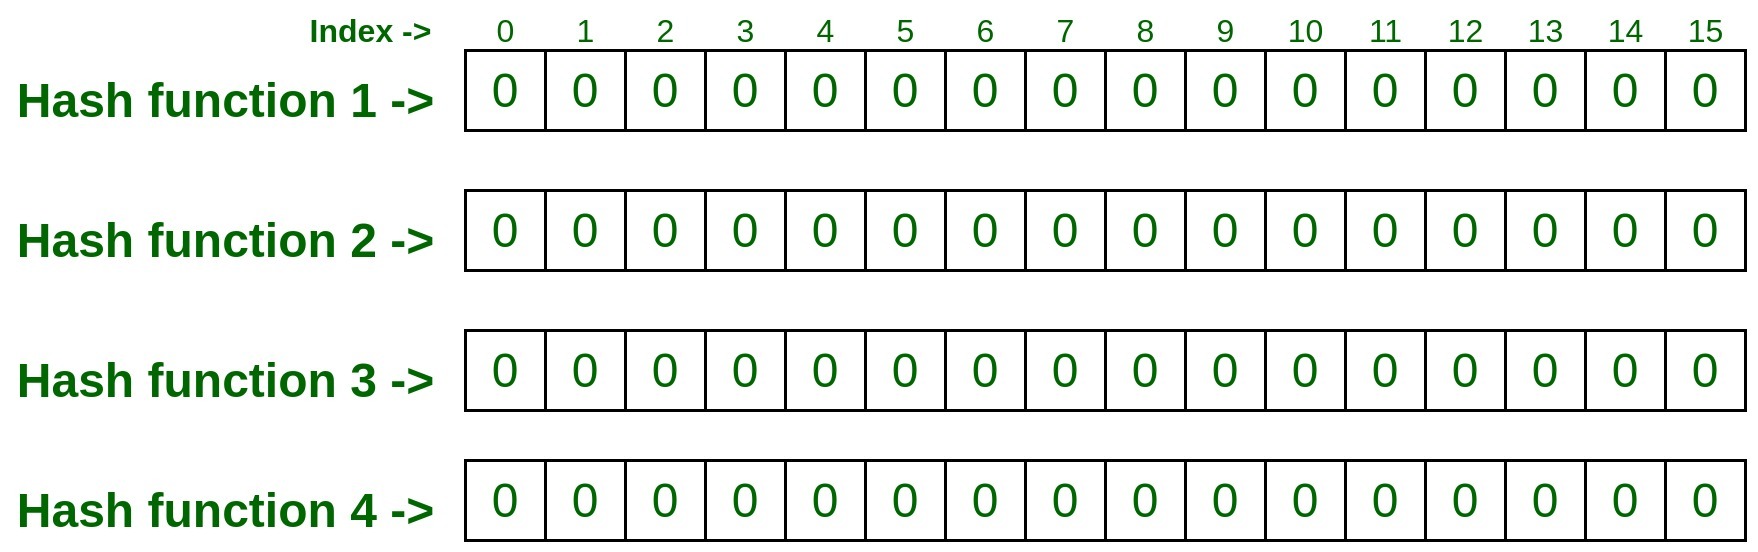
Let's look at the below example step by step.
👁 ImageNote: The more accurate result you want, the more hash function to be used.
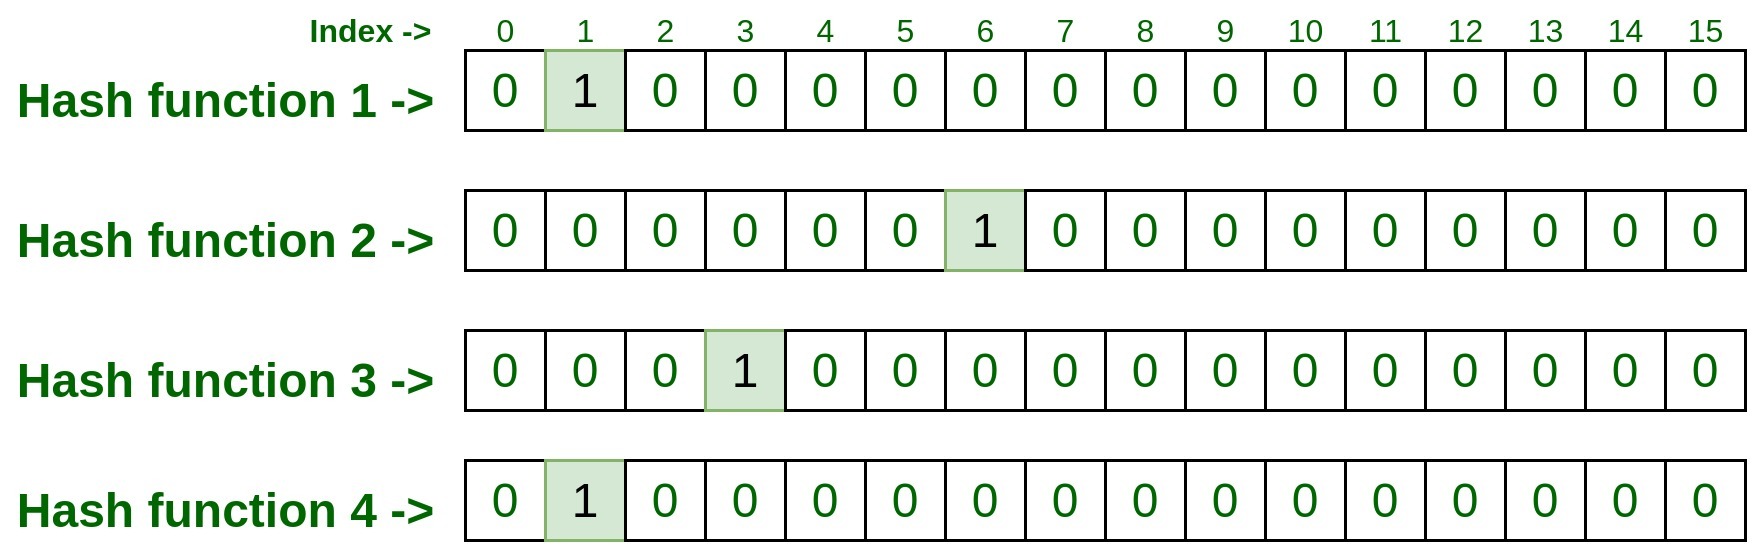
To do so we have to pass that element with all four hash functions which will result as follows.
Passing the input through Hash Functions:
- hashFunction1(192.170.0.1): 1
- hashFunction2(192.170.0.1): 6
- hashFunction3(192.170.0.1): 3
- hashFunction4(192.170.0.1): 1
Now visit the indexes retrieved above by all four hash functions and mark them as 1.
👁 Image
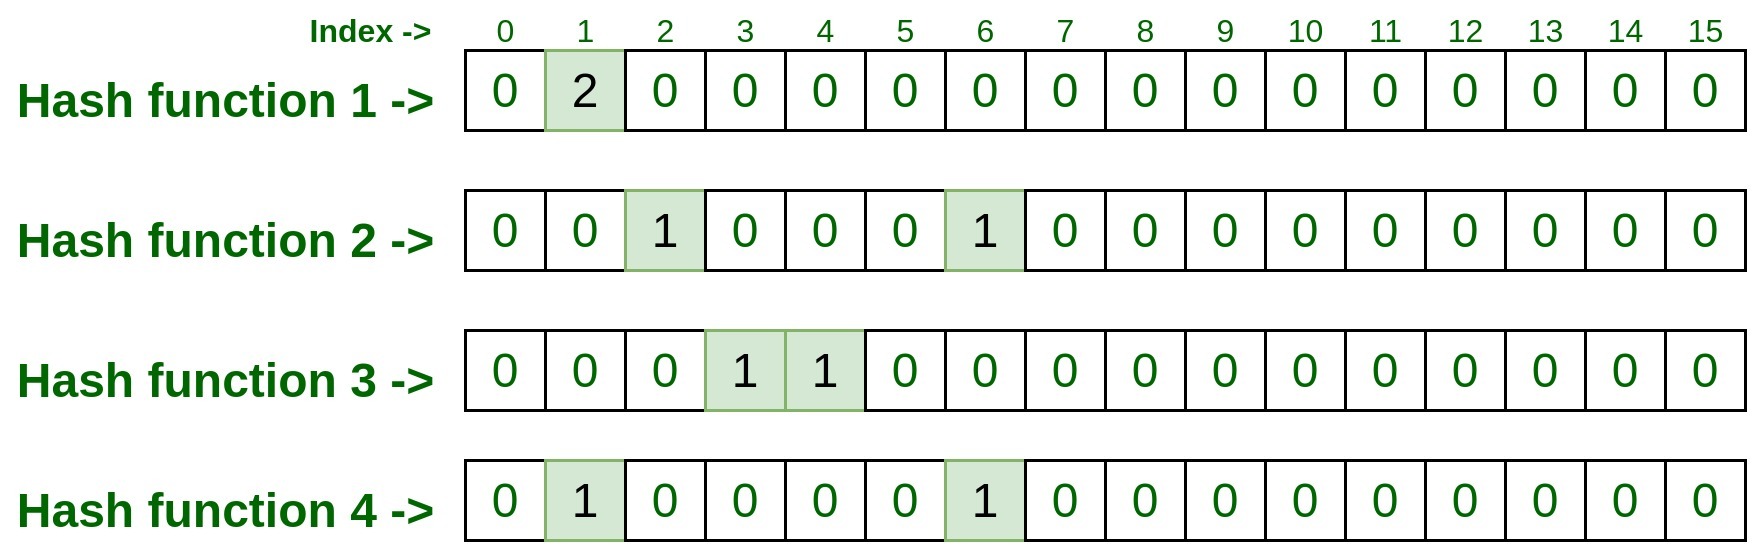
Passing the input through Hash Functions:
- hashFunction1(75.245.10.1): 1
- hashFunction2(75.245.10.1): 2
- hashFunction3(75.245.10.1): 4
- hashFunction4(75.245.10.1): 6
Now visit the indexes retrieved above by all four hash functions and mark them as 1.
Now, take these indexes and visit the matrix, if the given index has already been marked as 1. This is called collision,i.e., the index of that row was already marked by some previous inputs.
In this case, just increment the index value by 1.
In our case, since we have already marked index 1 of row 1 i.e., hashFunction1() as 1 by previous input, so this time it will be incremented by 1, and now this cell entry will be 2, but for the rest of the index of rest rows, it will be 0, since there was no collision.
👁 Image
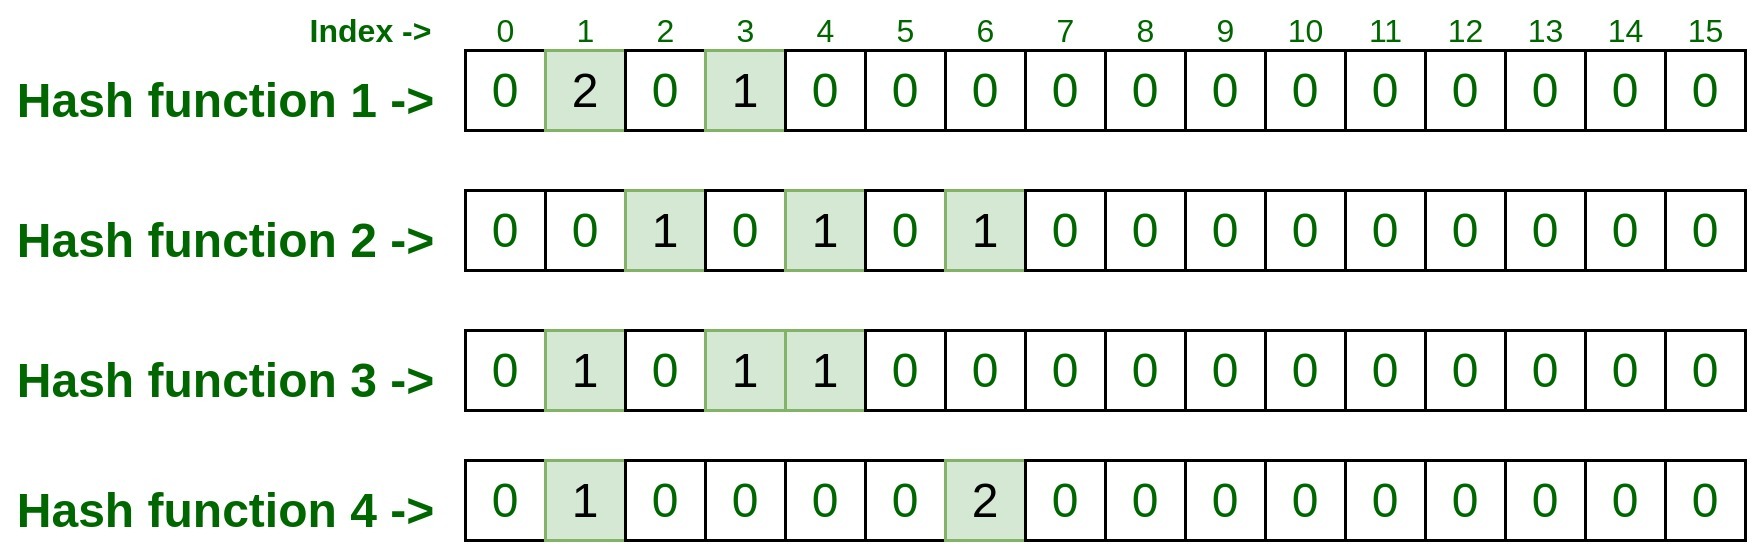
Passing the input through Hash Functions:
- hashFunction1(10.125.22.20): 3
- hashFunction2(10.125.22.20): 4
- hashFunction3(10.125.22.20): 1
- hashFunction4(10.125.22.20): 6
Lets, represent it on matrix, do remember to increment the count by 1 if already some entry exist.
👁 Image
Passing the input through Hash Functions:
- hashFunction1(192.170.0.1): 1
- hashFunction2(192.170.0.1): 6
- hashFunction3(192.170.0.1): 3
- hashFunction4(192.170.0.1): 1
Lets, represent it on matrix, do remember to increment the count by 1 if already some entry exist.
👁 Image
Now let's test some element and check how many time are they present.
Pass above input to all four hash functions, and take the index numbers generated by hash functions.
- hashFunction1(192.170.0.1): 1
- hashFunction2(192.170.0.1): 6
- hashFunction3(192.170.0.1): 3
- hashFunction4(192.170.0.1): 1
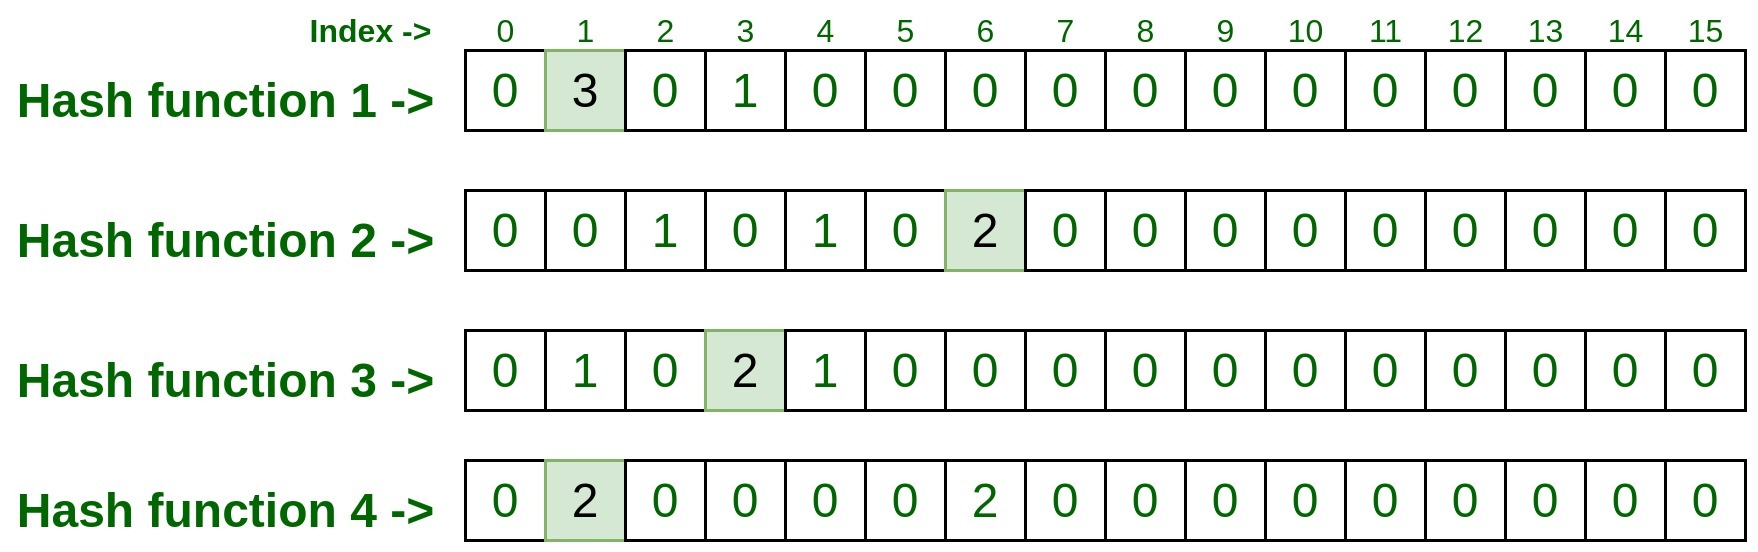
Now visit to each index and take note down the entry present on that index.
👁 ImageSo the final entry on each index was 3, 2, 2, 2.
Now take the minimum count among these entries and that is the result. So min(3, 2, 2, 2) is 2, that means the above test input is processed 2 times in the above list.
Hence Output (Frequency of 192.170.0.1) = 2.
Pass above input to all four hash functions, and take the index numbers generated by hash functions.
- hashFunction1(10.125.22.20): 3
- hashFunction2(10.125.22.20): 4
- hashFunction3(10.125.22.20): 1
- hashFunction4(10.125.22.20): 6
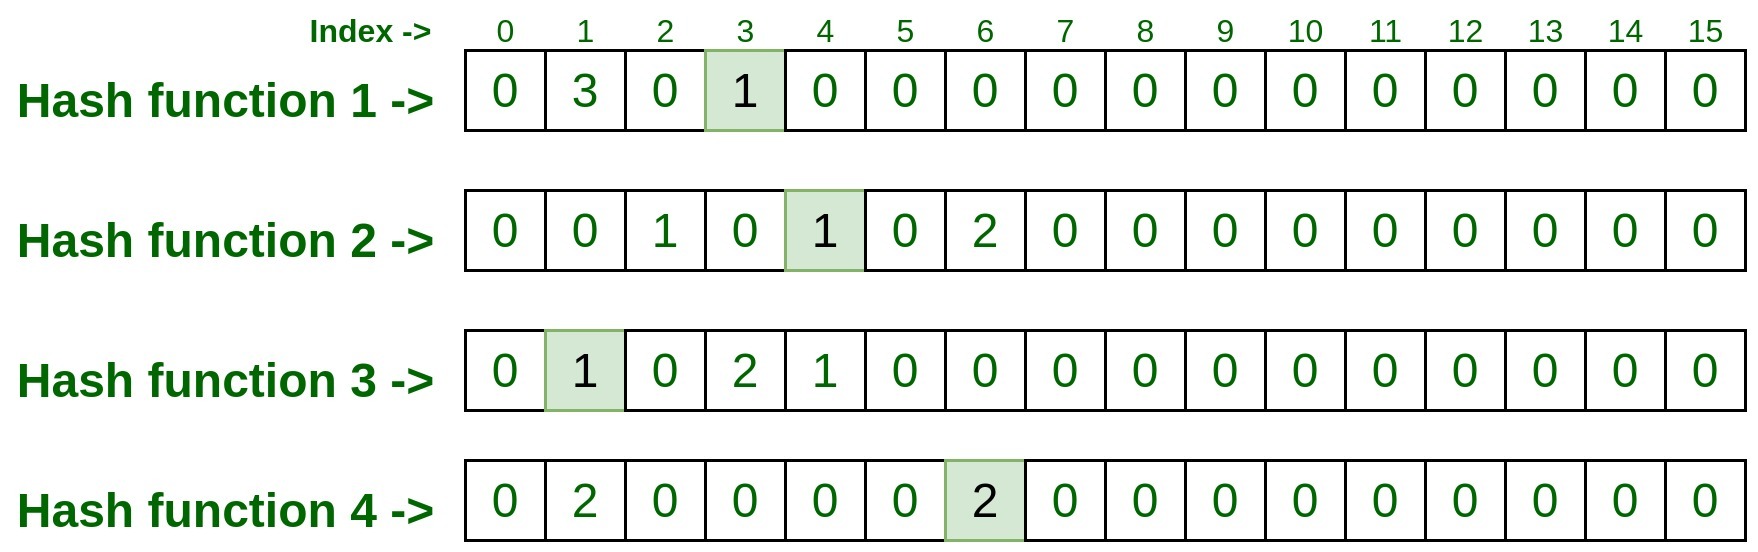
Now visit to each index and take note down the entry present on that index.
👁 ImageSo the final entry on each index was 1, 1, 1, 2.
Now take the minimum count among these entries and that is the result. So min(1, 1, 1, 2) is 1, that means the above test input is processed only once in the above list.
Hence Output (Frequency of 10.125.22.20) = 1.
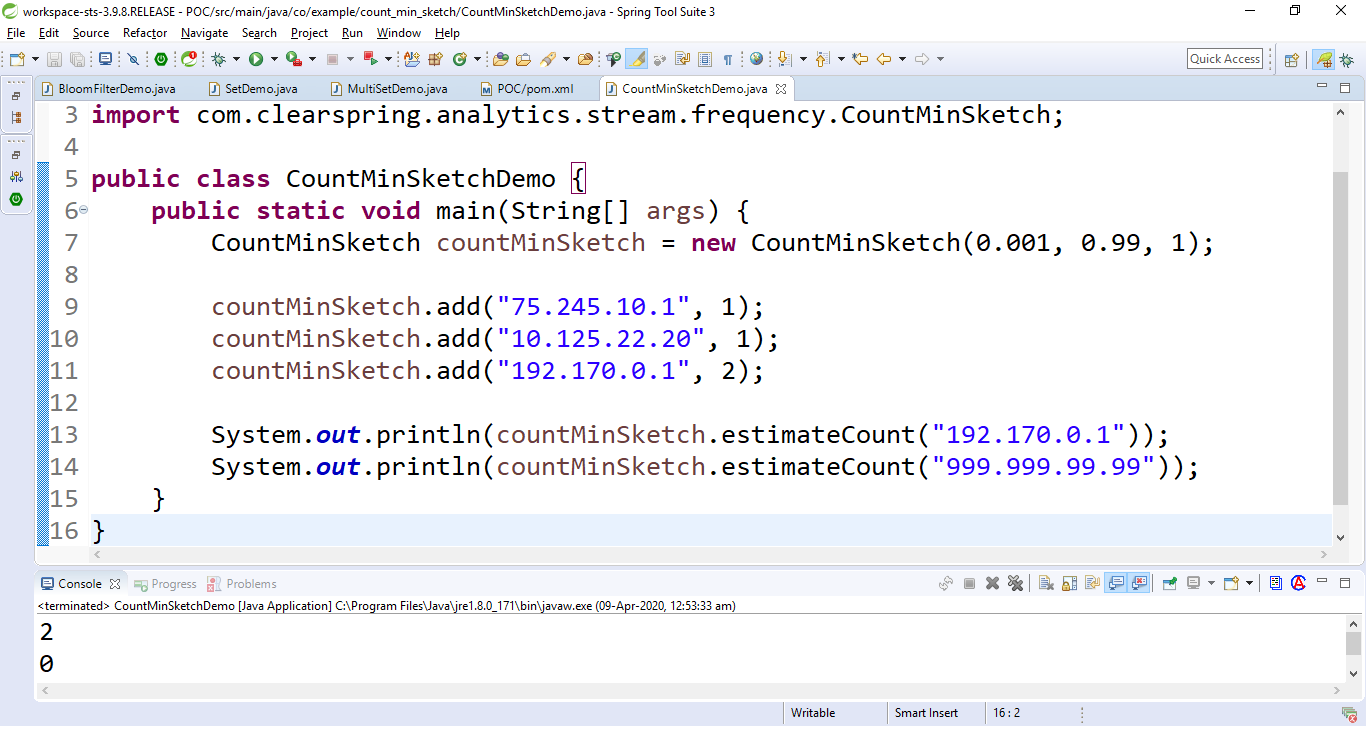
We can implement the Count-min sketch using Java library provided by Guava. Below is the step by step implementation:
Above example takes three arguments in the constructor which are
- 0.001 = the epsilon i.e., error rate
- 0.99 = the delta i.e., confidence or accuracy rate
- 1 = the seed
Output:
👁 ImageNow let's look at the time and space consumed with this type of approach (wrt to above Java-Guava Implementation)
Number of UUIDs | Multiset Insertion Time(ms) | CMS Insertion Time(ms) |
|---|---|---|
|
10 |
<25 |
35 |
|
100 |
<25 |
30 |
|
1,000 |
30 |
69 |
|
10,000 |
257 |
246 |
|
100,000 |
1200 |
970 |
|
1,000,000 |
4244 |
4419 |
Let's have a look at the memory (space) consumed:
Number of UUIDs | Multiset JVM heap used(MB) | CMS JVM heap used(MB) |
|---|---|---|
|
10 |
<2 | N/A |
|
100 |
<2 | N/A |
|
1,000 |
3 | N/A |
|
10,000 |
9 | N/A |
|
100,000 |
39 | N/A |
|
1,000,000 |
234 | N/A |
What if one or more elements got the same hash values and then they all incremented. So, in that case, the value would have been increased because of the hash collision. Thus sometimes (in very rare cases) Count-min sketch overcounts the frequencies because of the hash functions.
So the more hash function we take there will be less collision. The fewer hash functions we take there will be a high probability of collision. Hence it always recommended taking more number of hash functions.
We have observed that the Count-min sketch is a good choice in a situation where we have to process a large data set with low memory consumption. We also saw that the more accurate result we want the number of hash functions(rows/width) has to be increased.