 |
VOOZH | about |
|
VOOZH | about |
Functions in Excel are the pre-defined formulae used to obtain a certain value and to perform calculations using the specific value in a certain order. The basic functions are SUM, AVG, MAX, MIN, etc used for the range of cells. In order to obtain the correct results from the function, the correct syntax of the functions is required. In this article, we will discuss VAR.P FUNCTION & VAR.S FUNCTION, the difference between VAR.P FUNCTION & VAR.S FUNCTION, and demonstrate how to calculate each in an excel sheet.
The VAR.P function is classified as an Excel statistical function. This function returns the variance of a given set of values. This was introduced in the 2010 version of MS Excel.
Variance is a statistical measure used across a range of values to determine how much the values differ from the mean. As a financial analyst, the VAR.P function helps me calculate sales variances. Portfolio managers often use this feature to measure and track portfolio risk.
Formula of VAR.P Function
=VAR.P(number1,[number2],...)
number 1 (mandatory argument): This is the first argument corresponding to the population.
number 2 (optional arguments): where number arguments can be up to 254 values or an array of values that provide at least two values to the function.
When providing arguments, you should be aware of the following:
The Excel Statistical functions section includes the VAR.S Function. The variance of a sample will be returned by this function. It debuted in Excel 2010's edition. As we are all aware, variance is a statistical term used to describe the degree to which a group of data deviates from the average value. Variance can be used in financial analysis to identify the risks an investment is taking. The majority of portfolio managers utilize it to choose how to distribute the assets and investments of their clients.
Formula of VAR.S Function
=VAR.S(number1,[number2],…)
number 1 (required argument) -is the first argument, which must represent a sample of the population.
number 2 (optional argument) - The function may accept up to 254 values or arrays of values each containing at least two values.
We must keep the following in mind while we present the arguments,
First, we need to know what is VAR.P function. VAR.P means variance of the entire population. while VAR.S means variance of the entire sample. Variance is a measure of the spread of data distribution. it measures the distance of the data point from the mean of the dataset. the smaller the variance of a dataset to each other. There are two formulas used to calculate the variance of the dataset:
First, we need to know what is VAR.P function. VAR.P means variance of the entire population. while VAR.S means variance of the entire sample. Variance is a measure of the spread of data distribution. it measures the distance of the data point from the mean of the dataset. the smaller the variance of a dataset to each other. There are two formulas used to calculate the variance of the dataset:
Usually, we would like to calculate the variance of all the data points in the population of interest. However, we do not have access to all data points in the population. So we select a subset of the population of interest which we refer to as the sample. with the sample, we then try to approximate the variance of the population using the sample. Use the VAR.P function when
Use the VAR. function when your dataset represents the sample of a population and you wish to use your finding to generalize ( estimate) the population. this is the case most of the time.
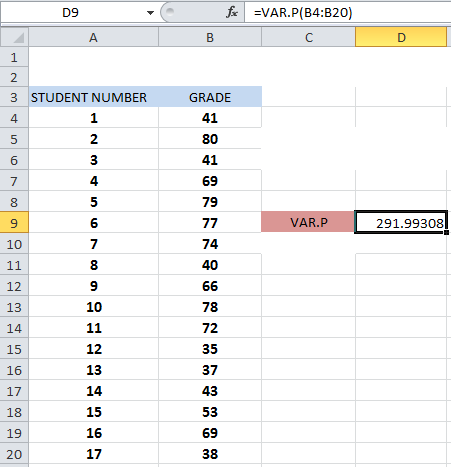
Example: Ms. Puja teaches Statistics 101 at a local college. The table below shows the percentage grade of the 2022 statistic 101 fall semester students. Use the data to estimate the variance of the percent grade of Ms puja's statistic 101 students.
Here we are interested in only Ms. puja's 2022 statistic 101 fall semester student and the given dataset student and the given dataset contains all the grades of Ms puja's 2022 statistic 101 fall semester students. So the given dataset is treated as the population of interest. Thus we use the VAR.P function to calculate the variance as shown in the figure below:
Output:
Example: Ms. Puja teaches Statistics 101 at a local college. the table below shows the percentage grade of the 2022 statistic 101 fall semester students. Use the data to estimate the variance of the percent grade of Ms puja's statistic 101 students.
Here we are interested in only Ms. puja's 2022 Statistics 101 fall semester student and the given dataset student and the given dataset contains all the grades of Ms puja's 2022 Statistics 101 fall semester student. so the given dataset is treated as the population of interest. thus we use the VAR.S function to calculate the variance as shown in the figure below.
Output: