 |
VOOZH | about |
|
VOOZH | about |
Correlation is the way to measure the relation between two variables. The value of the correlation lies between -1 to 1. If the value is greater than0 then both the values are positively correlated, if the value of the correlation is 0 then there is no such relation between the two variables and if the value is less than 0 then the two values are negatively correlated.
Partial Correlation is used to measure the relationship between two different variables by eliminating the third variable. The partial correlation matrix calculates the coefficients of partial correlation of a matrix. In the partial correlation matrix row i and column j have a partial correlation with the row i and column j of the original matrix. In this article, we will discuss calculating a partial correlation matrix in Excel VBA.
Following are the steps to calculate the partial correlation matrix with Excel VBA are:
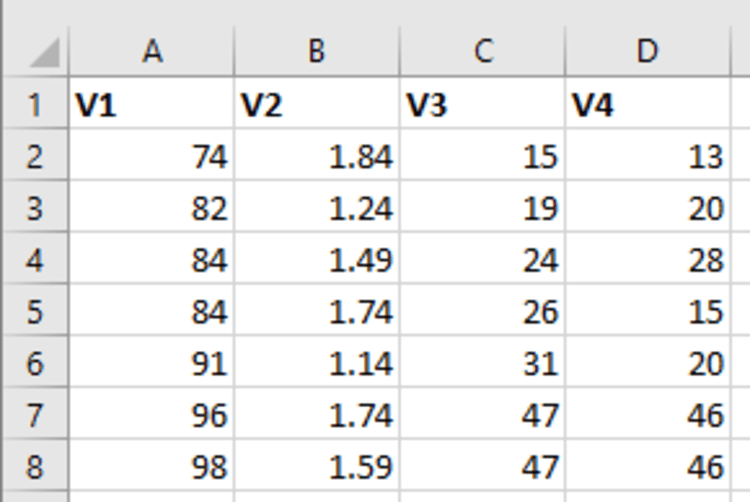
Step 1: Given sample data, which has 5columns named V1, V2, V3, and V4. Each column has 7 rows, with different numbers in it.
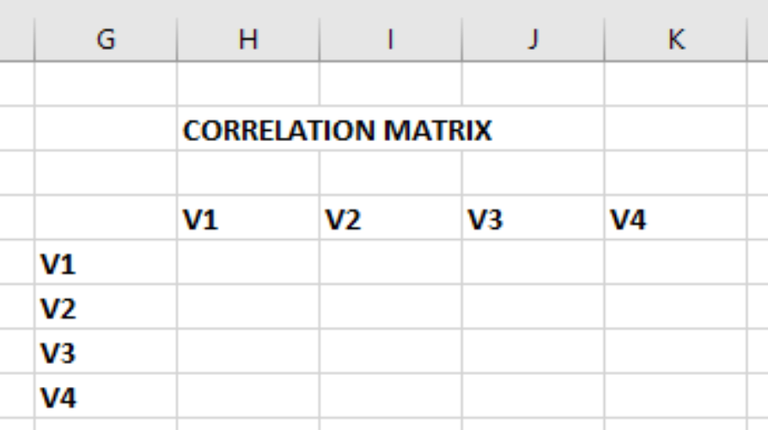
Step 2: Before calculating the partial correlation matrix, we need to calculate the correlation matrix for the given data. Make a new table, where H4 = V1, I4 = V2, J4 = V3, and K4 = V4. Similarly, G5 = V1, G6 = V2, G7 = V3, and G8 = V4.
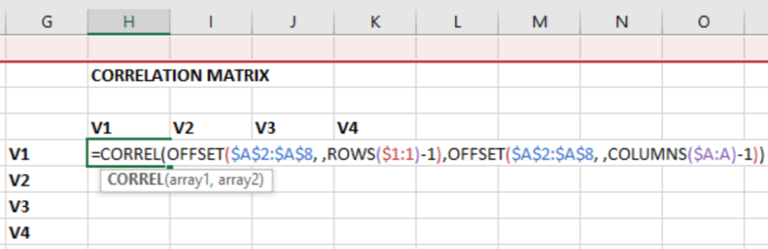
Step 3: Enter the following formula in the H5 cell to calculate the correlation of the variables. We have an in-built function in Excel, to calculate the correlation matrix i.e. =correl(array1, array2). Now, we have to pass arguments, in the correl function, which can easily be achieved using the offset function, as it takes a range of elements.
=CORREL(OFFSET($A$2:$A$8, ,ROWS($1:1)-1),OFFSET($A$2:$A$8, ,COLUMNS($A:A)-1))
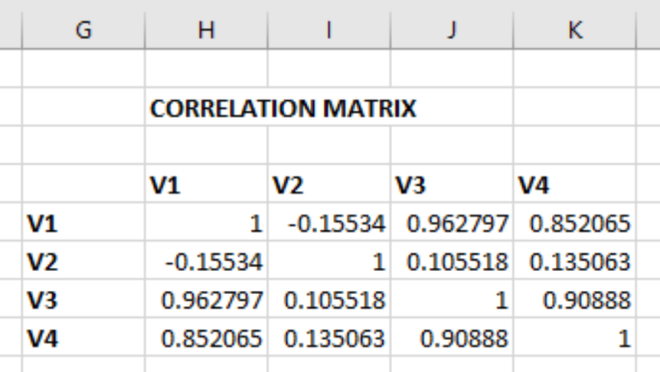
Step 4: After getting the correlation for the V1 row and column, drag the cell from H5 to K8. The same formula as in H5, will be copied to all other cells.
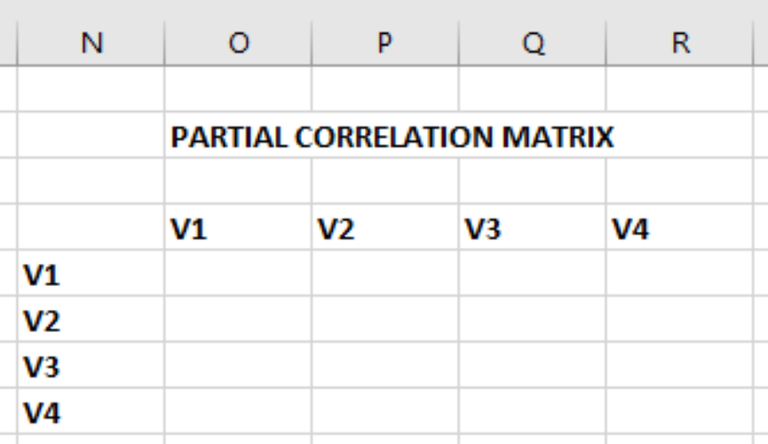
Step 5: For calculating the partial correlation matrix we need to first create a table. Make a new table, where O4 = V1, P4 = V2, Q4 = V3, and R4 = V4. Similarly, N5 = V1, N6 = V2, N7 = V3, and N8 = V4. Then, press Alt + F11 to get the VBA Code Editor.
Step 6: Click onthe Insert tab and select Module.
Step 7: Enter the following code in the Module to calculate the Partial Correlation matrix. Knowing the working of the code is not so important, because this is a general code, and can work for any table. After adding the code, close the VBA window.
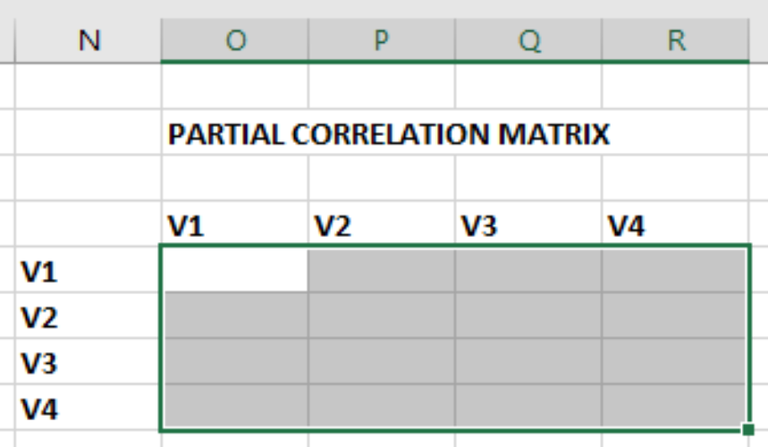
Step 8: Now, select the cells, from range O5:R8.
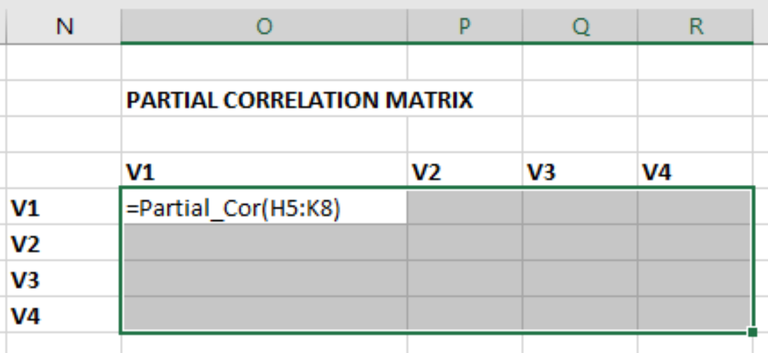
Step 9: As we can see in the VBA code, the name of the function is Partial_Cor. Enter =Partial_Cor(H5:K8) in the O5 cell and then click Ctrl+Shift+Enter.
Step 10: We will get the Partial Correlation Matrix.