 |
VOOZH | about |
|
VOOZH | about |
Sales data plays a critical role in helping businesses understand performance, customer demand, and revenue growth. However, raw sales records often lack clarity until they are properly analysed and structured. This project focuses on converting transaction-level sales data into meaningful business insights using spreadsheet calculations and data summarisation techniques. The goal is to transform raw sales records into meaningful business insights such as:
To perform structured and scalable sales analysis, this project uses a combination of formula-driven calculations and interactive data summarisation tools.
Spreadsheet functions act as the core building blocks for data manipulation and analysis.
Key Functions Used:
Business Benefits:
Pivot Tables transform simple datasets into multi-dimensional analytical views. They allow users to summarise large datasets, extract trends, and analyse specific segments without writing complex formulas.
Business Benefits:
Below are practical examples of how functions are used in real sales datasets.
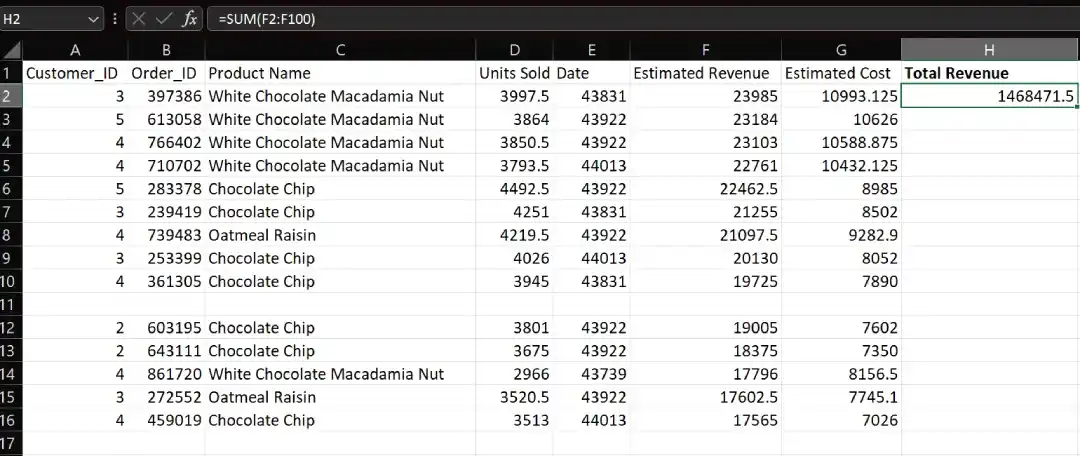
Calculates total revenue across the selected dataset.
=SUM(F2:F100)
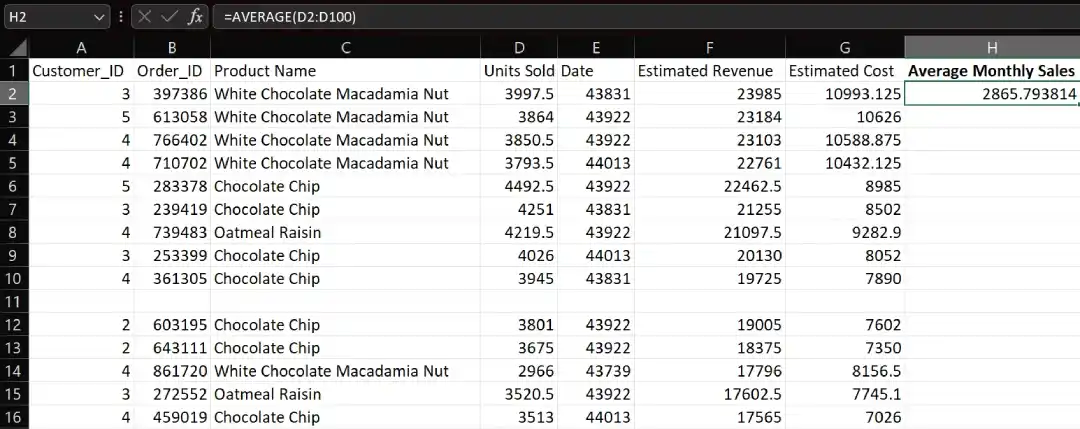
Finds the typical monthly sales value.
=AVERAGE(D2:D100)
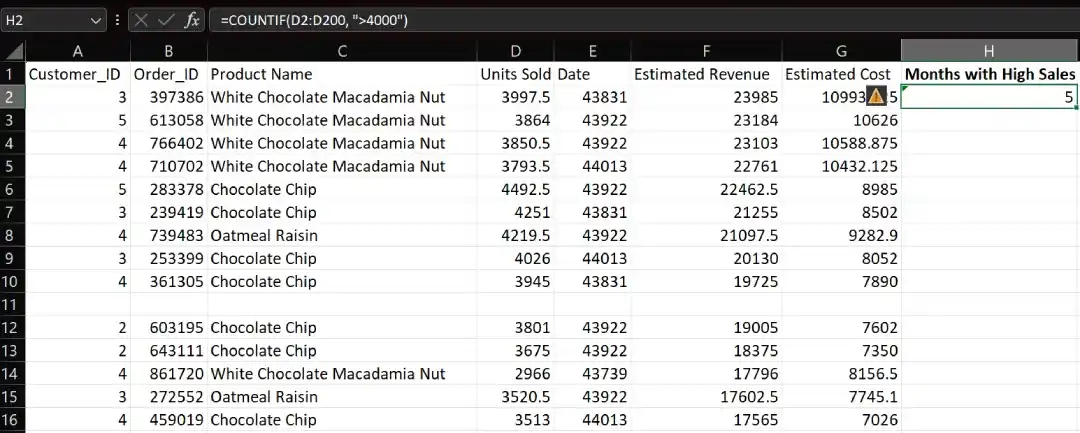
Counts months where sales exceeded target thresholds.
=COUNTIF(D2:D200, ">4000")
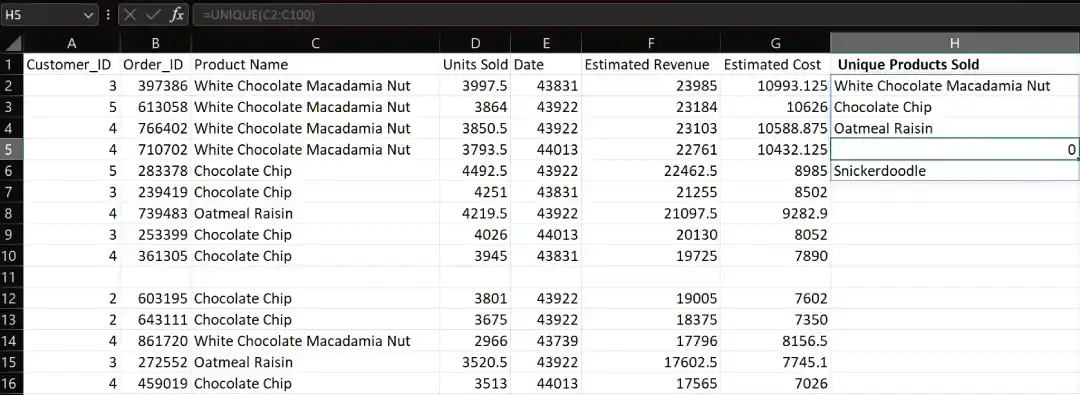
Extracts distinct products from the dataset.
=UNIQUE(A2:A100)
This provides a consolidated product-wise monthly sales view.
This enables location-based performance analysis.
Using Value Field Settings, additional metrics can be calculated:
Business Insight:
Trend-based forecasting functions help predict future sales performance.
=FORECAST(...)
Logical functions can classify performance levels.
=IF(AND(D2>10000, E2>1000), "High Performing", "Needs Improvement")
This helps quickly identify high-value sales records.
Using UNIQUE and SORT, basic product combination patterns can be explored, supporting:
Advanced Pivot calculations enable deeper insights such as:
These techniques are widely applicable across industries: