How to Find Correlation Coefficient in Google Sheets
Last Updated : 4 Oct, 2025
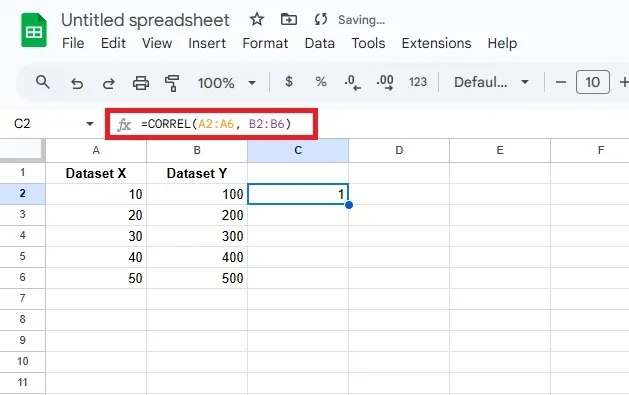
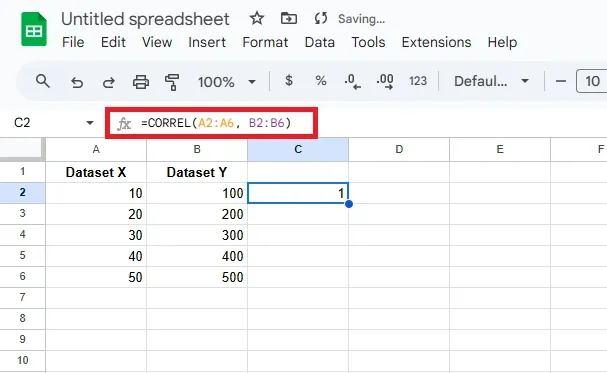
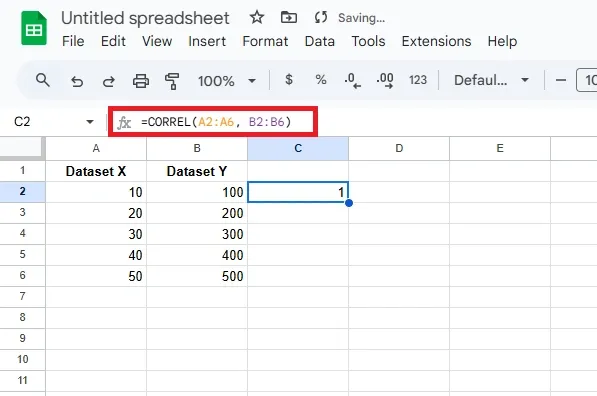
The CORREL function in Google Sheets calculates the correlation coefficient between two datasets. Correlation measures the strength and direction of the relationship between the datasets, making it a valuable tool for statistical and data analysis.
How it Works:
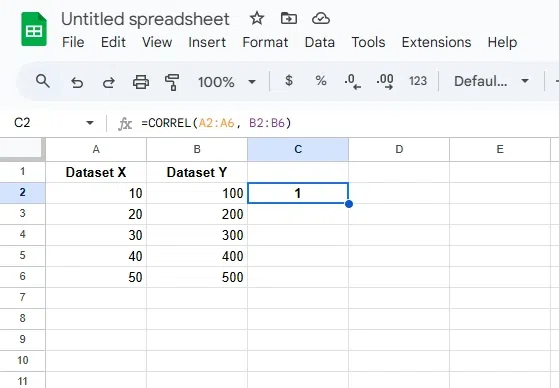
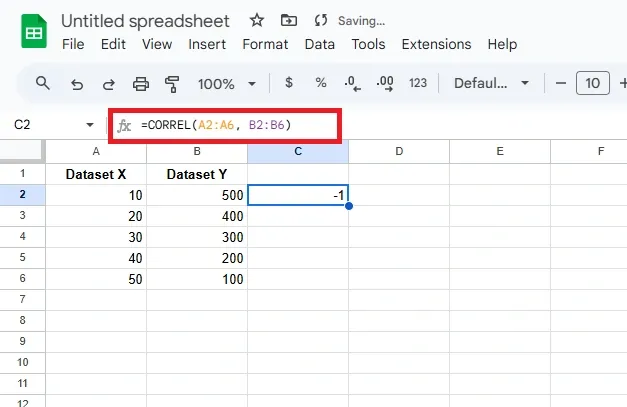
The CORREL function determines how closely two datasets are related by returning a value between -1 and 1.
A result close to 1 indicates a strong positive correlation (as one increases, the other increases).
A result close to -1 indicates a strong negative correlation (as one increases, the other decreases).
A result near 0 means little to no correlation between the datasets.
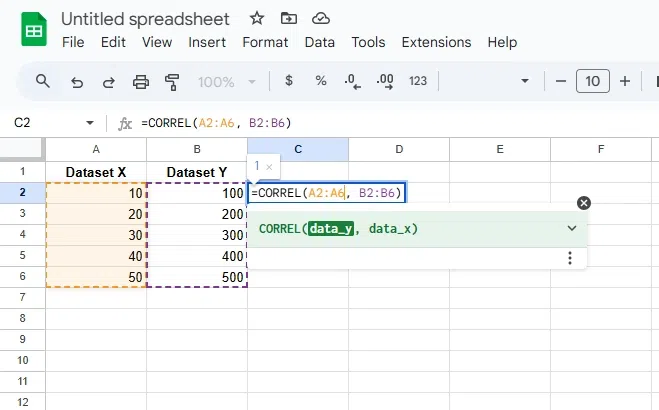
Syntax of CORREL Function
The syntax of Google Sheets CORREL statement:
CORREL(data_y, data_x)
data_y: The range of numeric values for the first dataset.
data_x: The range of numeric values for the second dataset.
1. How to Use the CORREL Function in Google Sheets
Before using the CORREL function in Google Sheets, ensure you have two sets of data to analyze the relationship between them. Follow the steps below to calculate the correlation coefficient
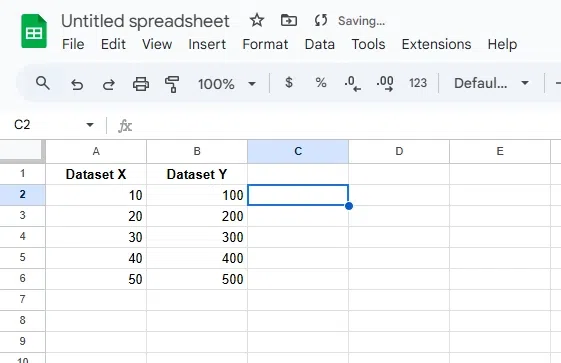
Step 1: Prepare Your Data
Ensure you have two sets of numerical data in two separate columns.
Step 2: Select the Cell for the Result
Click on the cell where you want the correlation coefficient to appear.
2. Different Methods and Interpretations of Correlation in Google Sheets
It categorizes the various ways to calculate and interpret correlation using the CORREL function in Google Sheets. It covers brackets, range references, and understanding positive and negative relationships.
2.1 Correlation Using Brackets
The CORREL function can calculate the correlation directly by providing two arrays within brackets.
Example: =CORREL({1, 2, 3}, {4, 5, 6}) calculates the correlation between two datasets.
How to Use: Enter the formula in a cell with both datasets enclosed in curly brackets.
