 |
VOOZH | about |
|
VOOZH | about |
The COVAR function in Google Sheets calculates the covariance between two sets of data. Covariance indicates how two variables change together—whether they have a positive relationship, negative relationship, or no relationship at all. It's particularly useful in statistics and financial analysis for understanding relationships between data points.
The COVAR function measures how two datasets vary together, identifying positive, negative, or no relationships.
Here is the syntax of the Google Sheets COVAR statement:
COVAR(data_y, data_x) To use the COVARIANCE function in Google Sheets and calculate the covariance between two datasets, follow these simple steps.
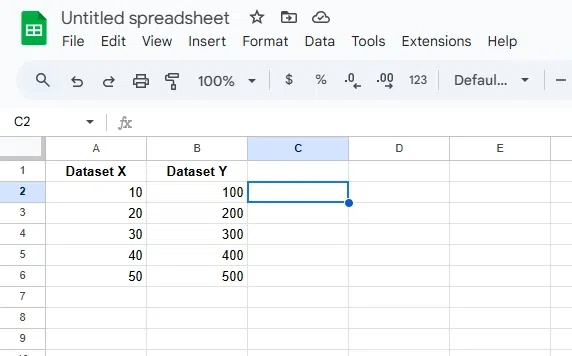
Ensure you have two sets of numerical data in two separate columns in your Google Sheets.
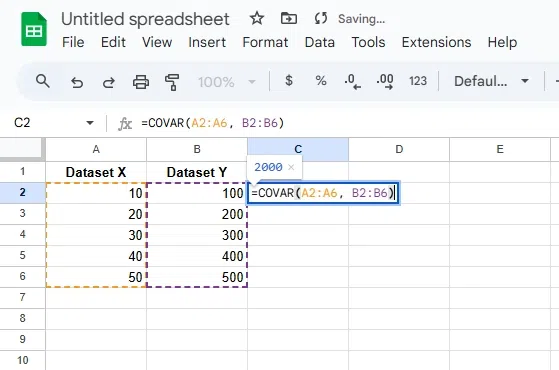
Click on the cell where you want the covariance result to appear.
Type the formula in the selected cell, replacing range_y and range_x with the actual data ranges. For example: =COVAR(A2:A6, B2:B6)
=COVAR(range_y, range_x)
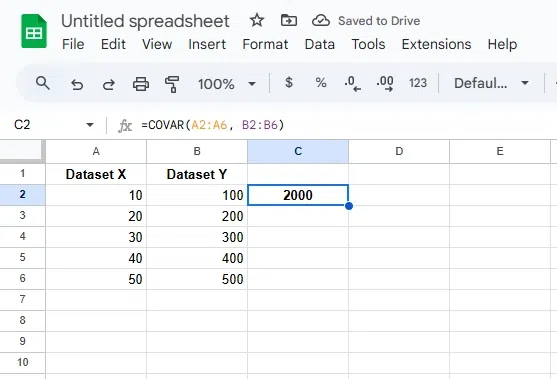
Hit Enter to get the covariance value, which will show how the two datasets vary together.