 |
VOOZH | about |
|
VOOZH | about |
Chart.js is an open-source JavaScript library available on GitHub that enables the creation of various types of charts using the HTML5 <canvas> element. Since it relies on the canvas API, a polyfill may be needed to ensure compatibility with older browsers that do not natively support the canvas element.
The HTML5 <canvas> element provides a simple and efficient way to draw graphics using JavaScript. It can be used for a variety of purposes, such as drawing graphs, creating photo compositions, or making both simple and complex animations. One of its key features is its responsiveness, meaning it automatically resizes and redraws the chart when the browser window is resized, ensuring perfect scaling and clarity.
This library supports 8 different types of graphs:
Latest version of Chart.js can be downloaded from the Github or use a Chart.js CDN.
Steps to create a chart:
Step 1: First include the chart.js in the HTML.
</p><pre><code class="language-html"><head>
	<script src=
"https://cdnjs.cloudflare.com/ajax/libs/Chart.js/2.7.2/Chart.bundle.js">
</script>
	<link rel="stylesheet" type="text/css" href="style.css">
</head></code></pre><p></p><h3><b><strong>Create canvas:</strong></b><span> </span></h3><p dir="ltr"><span>To create a chart we need to represent the Chart class. In order to do this, we need to pass jQuery instance or 2d context of the canvas of where we want the place or draw the chart. For example: </span><gfg-tabs data-run-ide="false" data-mode="light"><gfg-tab slot="tab">html
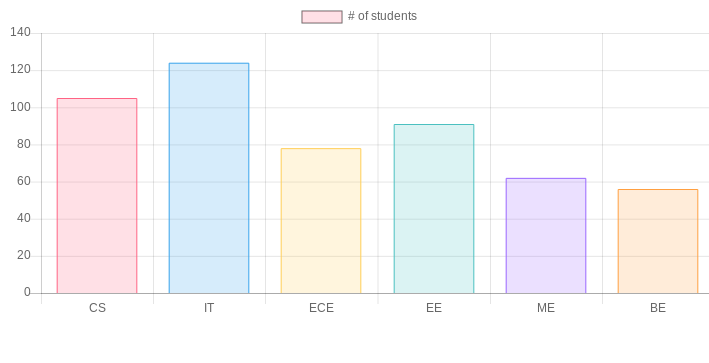
<canvas id = ”chart” width=”900” height = “900”> </canvas>Decide what type of chart is required and prepare the data accordingly. Data requires labels, datasets, data values, backgroundColor,borderColor, borderWidth and various other options. For example:
</p><pre><code class="language-javascript">labels:[“CS”, “IT” , “ECE” , “EE”, ”ME”, “BE”],
Anddatasets:
Label:‘#ofstudents’,
Data:[105,124,78,91,62,56],
backgroundColor:['rgba(255, 99, 132, 0.2)',
'rgba(54, 162, 235, 0.2)',
'rgba(255, 206, 86, 0.2)',
'rgba(75, 192, 192, 0.2)',
'rgba(153, 102, 255, 0.2)',
'rgba(255, 159, 64, 0.2)'
],

borderColor:[
'rgba(255,99,132,1)',
'rgba(54, 162, 235, 1)',
'rgba(255, 206, 86, 1)',
'rgba(75, 192, 192, 1)',
'rgba(153, 102, 255, 1)',
'rgba(255, 159, 64, 1)'
]</code></pre><span>And finally, we should decide the type of chart from a line, bar, radar, pie, doughnut, polar area, bubble and scatter. </span><p></p><h3><b><strong>Create a graph:</strong></b><span> </span></h3><p dir="ltr"><span>After defining what type of graph is to be drawn, pass the data to that graph that we want to visualize. Below is an example: </span><gfg-tabs data-run-ide="false" data-mode="light"><gfg-tab slot="tab">javascript
let ctx = document.getElementById("chart");
let myChart = new Chart(ctx, {
 type: 'bar',
 data: {
 Labels: [“CS”, “IT” , “ECE” , “EE”, ”ME”, “BE”],
 datasets: [
 {
 label: ‘# of students’,
 data : [105,124,78,91,62,56],
 backgroundColor :['rgba(255, 99, 132, 0.2)',
 'rgba(54, 162, 235, 0.2)',
 'rgba(255, 206, 86, 0.2)',
 'rgba(75, 192, 192, 0.2)',
 'rgba(153, 102, 255, 0.2)',
 'rgba(255, 159, 64, 0.2)'
],

borderColor: [
 'rgba(255,99,132,1)',
 'rgba(54, 162, 235, 1)',
 'rgba(255, 206, 86, 1)',
 'rgba(75, 192, 192, 1)',
 'rgba(153, 102, 255, 1)',
 'rgba(255, 159, 64, 1)'
 ],
borderWidth : 1

}
 }
 ]
Complete code to create a chart: