 |
VOOZH | about |
|
VOOZH | about |
Grafana is a powerful open-source platform used for monitoring and visualizing data. It integrates seamlessly with various data sources like Prometheus, InfluxDB, Elasticsearch, and many others. With Grafana, you can create dynamic and interactive dashboards that help in understanding metrics and logs in a visual format.
This makes it an invaluable tool for system administrators, developers, and data analysts who need real-time insights into their infrastructure, applications, and business metrics. This guide will walk you through the straightforward process of installing Grafana on a Debian system.
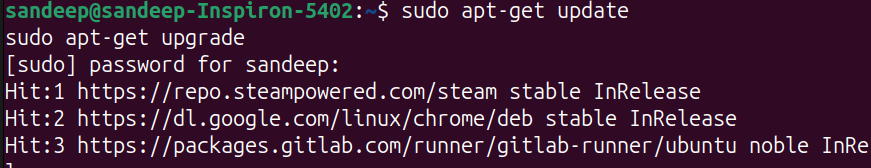
Before installing anything, it's essential to ensure your system is up-to-date. This helps avoid compatibility issues and ensures you have the latest security patches. Open a terminal and run these commands:
sudo apt-get updatesudo apt-get upgradeGrafana requires a few dependencies to run smoothly. Install them by running:
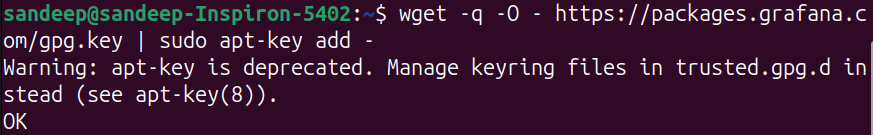
sudo apt-get install -y software-properties-common apt-transport-https wgetTo get the latest version of Grafana, add its official repository. First, import the GPG key:
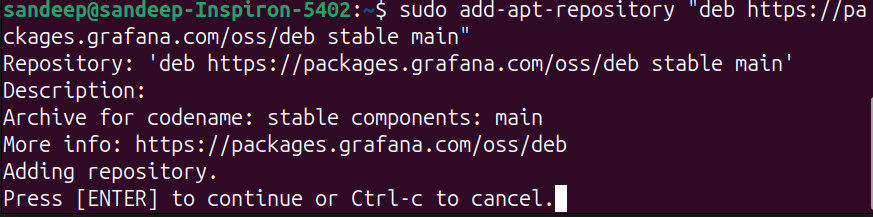
wget -q -O - https://packages.grafana.com/gpg.key | sudo apt-key add -Next, add the Grafana repository to your system:
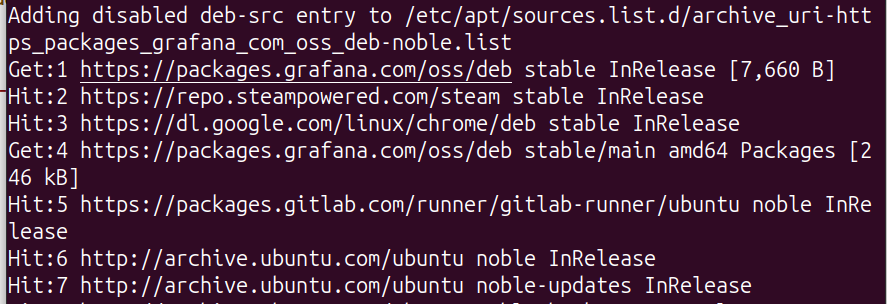
sudo add-apt-repository "deb https://packages.grafana.com/oss/deb stable main"Press [Enter] to continue
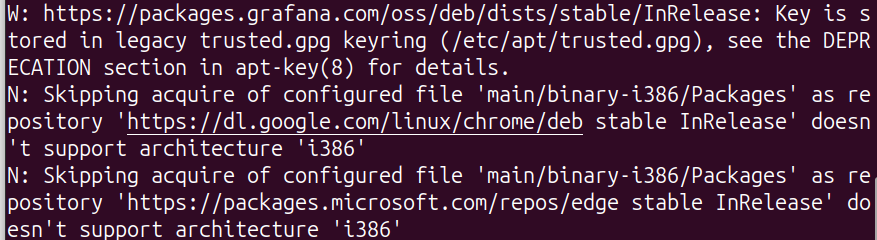
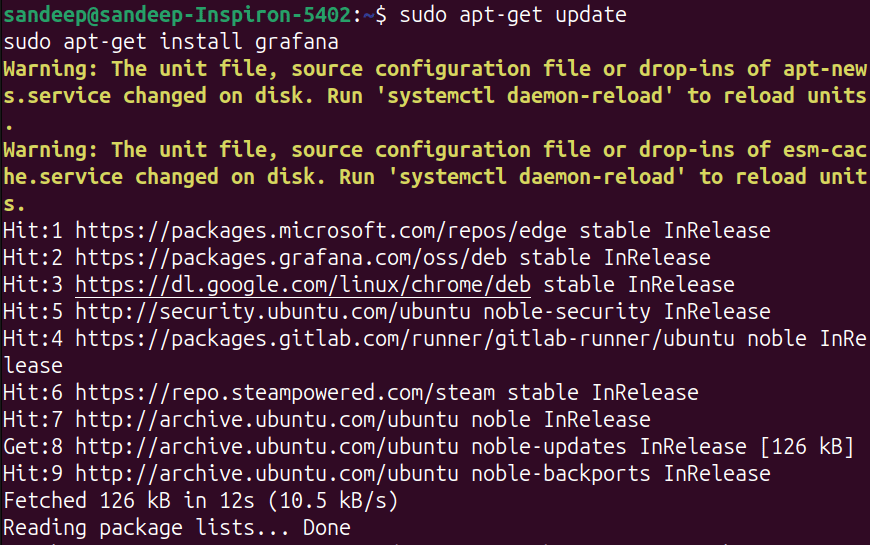
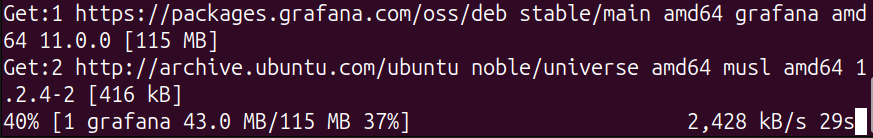
Now that the repository is added, install Grafana with these commands:
sudo apt-get updatesudo apt-get install grafanaAfter installation, start the Grafana service and enable it to start on boot:
sudo systemctl start grafana-serversudo systemctl enable grafana-serverGrafana should now be running. Open your web browser and go to:
arduino
http://localhost:3000The default login credentials are:
You will be prompted to change the password after the first login to enhance security.
For better security, consider setting up a reverse proxy with HTTPS. This can be done using Nginx or Apache. Here’s a basic example using Nginx:
Install Nginx:
sudo apt-get install nginxConfigure Nginx for Grafana by creating a new configuration file:
sudo nano /etc/nginx/sites-available/grafanaAdd the following configuration to the file:
nginx
server {
listen 80;
server_name your_domain.com;
location / {
proxy_pass http://localhost:3000;
proxy_set_header Host $host;
proxy_set_header X-Real-IP $remote_addr;
proxy_set_header X-Forwarded-For $proxy_add_x_forwarded_for;
proxy_set_header X-Forwarded-Proto $scheme;
}
}
Enable the configuration and restart Nginx:
sudo ln -s /etc/nginx/sites-available/grafana /etc/nginx/sites-enabled/sudo systemctl restart nginx(Optional) Obtain an SSL certificate using Let's Encrypt:
sudo apt-get install certbot python3-certbot-nginx sudo certbot --nginx -d your_domain.comCongratulations! You have successfully installed Grafana on your Debian system. Grafana's powerful features will now allow you to create insightful and visually appealing dashboards from a wide variety of data sources. Whether you are tracking server performance, monitoring application logs, or analyzing business metrics, Grafana provides the tools to visualize your data effectively. Take your time exploring its features, and consider integrating additional data sources and plugins to fully leverage Grafana's capabilities.
(5).png)