 |
VOOZH | about |
|
VOOZH | about |
Process management commands in Linux are used to monitor, control, and manage running processes on the system. These commands help users and administrators view active processes, control execution, analyze performance, and troubleshoot system behavior efficiently.
The following commands are used for process management in Linux.
The accton command is used to enable or disable process accounting. It records information about processes executed on the system.
Syntax:
accton file_nameExample:
accton on👁 OutputThe bg command is used to resume a stopped job in the background. It allows processes to continue running without blocking the terminal.
Syntax:
bg job_idExample:
bg %1The chrt command is used to set or view real-time scheduling attributes of a process. It controls process priority.
Syntax:
chrt [options] commandExample:
To see the current scheduling policy:
$ pidof -s firefoxNow to retrieve the current scheduling policy and priority for the firefox process, use chrt in the following way:
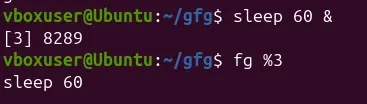
$ chrt -p 5794👁 To see the current scheduling policyThe fg command brings a background job to the foreground. It allows interaction with the running process.
Syntax:
fg job_idExample:
sleep 60 &👁 Lightbox
fg %3
The kill command is used to send signals to processes. It is commonly used to terminate unresponsive processes.
Syntax:
kill signal pidExample:
top
kill 1234
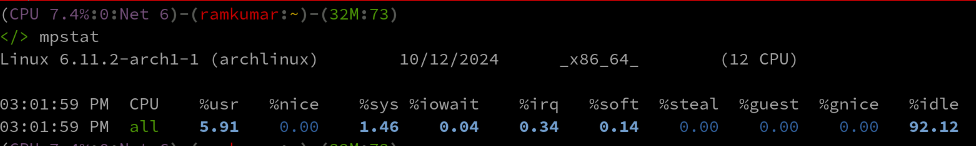
The mpstat command displays CPU usage statistics for processors. It helps monitor system performance.
Syntax:
mpstatExample:
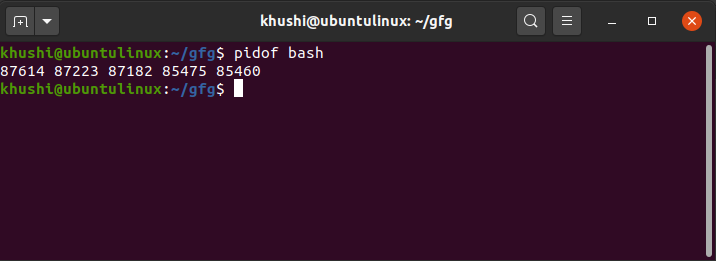
mpstat👁 Basic ExampleThe pidof command displays the process ID of a running program. It helps locate processes quickly.
Syntax:
pidof process_nameExample:
pidof bash👁 pidof-bashThe pmap command displays the memory usage of a process. It helps analyze memory consumption.
Syntax:
pmap pidExample:
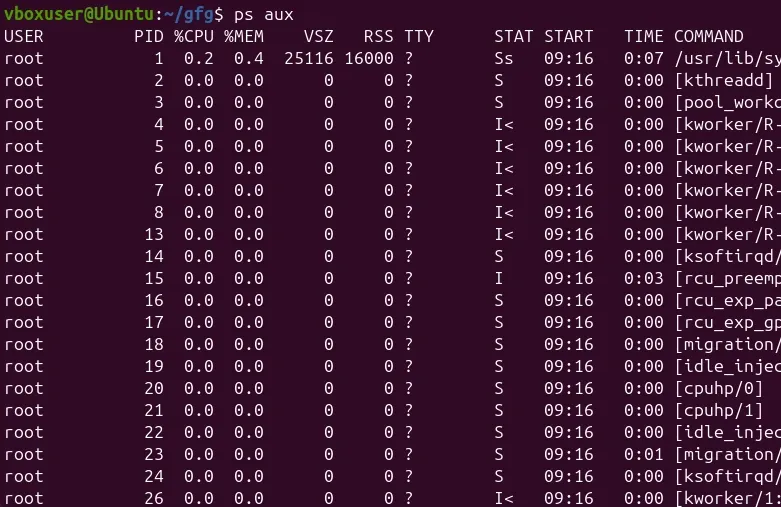
pmap 9123👁 Basic Example of pmap commandThe ps command displays information about running processes. It shows process ID, status, and resource usage.
Syntax:
psExample:
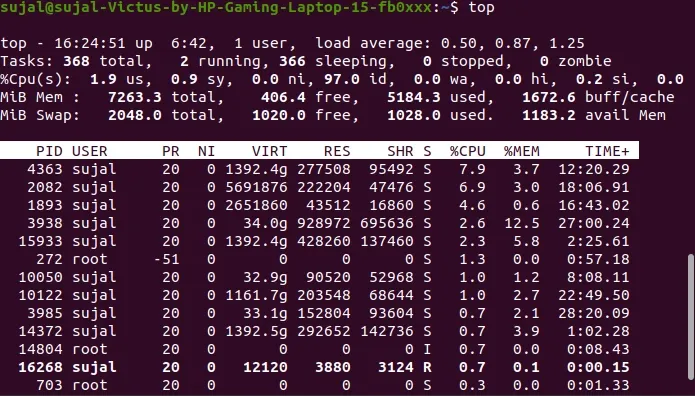
ps aux👁 fileThe top command provides a real-time view of running processes. It shows CPU and memory usage dynamically.
Syntax:
topExample:
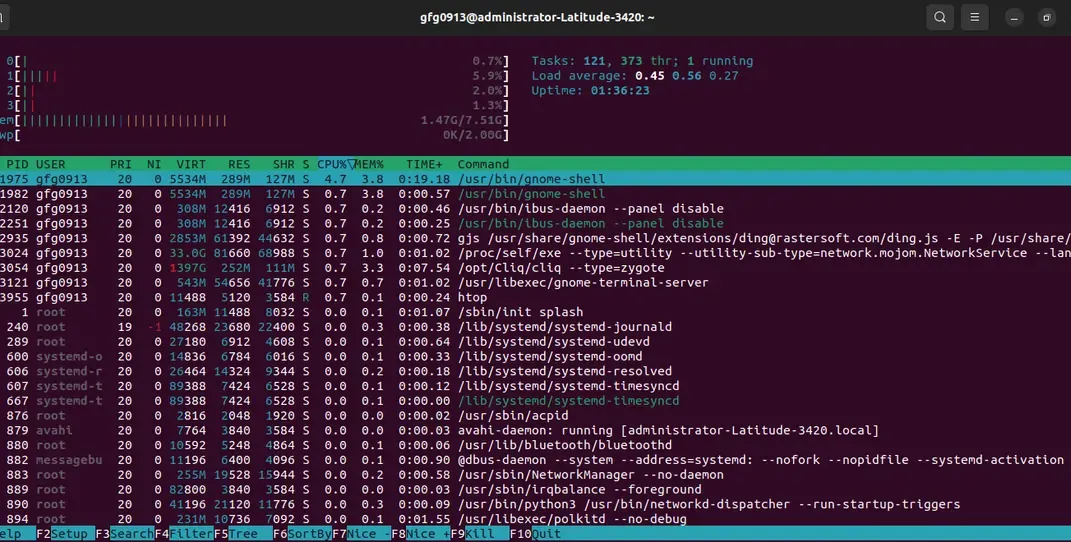
top👁 topThe htop command is an enhanced version of top. It provides a more user-friendly and interactive interface.
Syntax:
htopExample:
htopThe strace command traces system calls made by a process. It is useful for debugging applications.
Syntax:
strace commandExample:
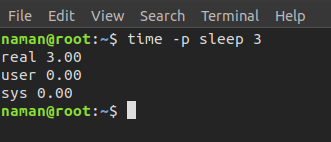
strace lsThe time command measures how long a command takes to execute. It displays execution time and resource usage.
Syntax:
time [options] command [arguments]Example:
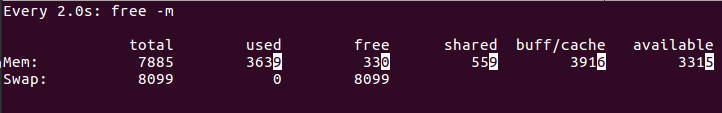
time -p sleep 3👁 ImageThe watch command runs a command repeatedly at fixed intervals. It is useful for monitoring changes.
Syntax:
watch [options] commandExample:
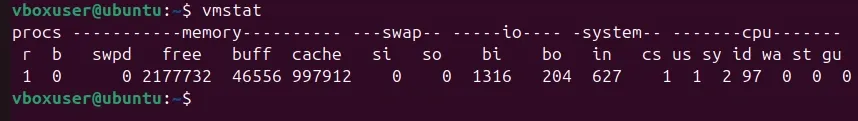
watch -d free -m👁 ImageThe vmstat command displays memory, CPU, and I/O statistics. It provides an overview of system performance.
Syntax:
vmstatExample:
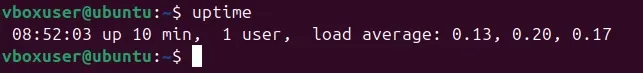
vmstatThe uptime command displays how long the system has been running. It also shows system load averages.
Syntax:
uptimeExample:
uptimeThe w command displays information about logged-in users and their running processes. It combines user and process details.
Syntax:
wExample:
w👁 Image